Trading Made Simple – TMS system
Forums › ProRealTime English forum › General trading discussions › Trading Made Simple – TMS system
- This topic has 26 replies, 5 voices, and was last updated 8 years ago by
 GraHal.
-
-
02/06/2016 at 1:47 PM #3066
This is the first topic of a series to introduce manual trading system that have made proof over time as I could have seen all over the internet forums, about trading. If you’re feeling not a technical analyst or like playing with indicators those threads will be your favorites ones 🙂
The TMS system aka “Trading Made Simple” is a common one. It first been post by ‘eelfranz’ in the forexfactory forum in 2011. Since, it has been traded by many with good results. I would like to make the indicators to trade this system available to the PRT traders community, so here there are.
I have never trade this system before, but i can consider give it a try if any would like to test it along with me or have any experience with it. Please give advices if you can ! 🙂
The TMS system is made of 3 indicators which the central one is the Trader Dynamic Index.
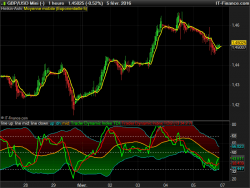
Here is the complete chart template :
_ price is Heiken Ashi style
_ Simple Moving Average, 5 periods, shifted 2 with typical price
_ the TDI indicator below, default configuration (see download link above in the indicators library)
The basic rules of entries are :
The yellow moving average is a visual reference on the main chart. When a candle cross the MA, the green line of the TDI cross also the red line. If TDI is rising up, that’s a long trade and a short one when it is declining. False signals may occur often if you take care of the main trend (higher timeframes). Also, good signals may take place when the crosses occurs in the overbought (above 68 line) and the oversold (below 32 line) areas.
Exit trades when the TDI cross again or the green line is going flat.
Of course like any other indicators made of system, the higher the timeframe, the better signals.
As i’m not the author of this strategy, i would recommend to trade it safely and to adapt it to your trading style. If you want to make change to the original strategy, please feel free to do it and to post your improvements in this forum thread.
1 user thanked author for this post.
02/06/2016 at 2:39 PM #3069This is a screener made of the basic rules for entries conditions of this system.
123456789101112131415161718192021222324252627282930//TDI indicator//parameters :lengthrsi=13lengthrsipl=2lengthtradesl=7//overbought and oversold values of the TDI indicatorupperzone = 60lowerzone = 40//heiken ashixClose = (Open+High+Low+Close)/4if(barindex>2) thenxOpen = (xOpen[1] + xClose[1])/2xHigh = Max(xOpen, xClose)xLow = Min(xOpen, xClose)endif//indicatorsr = rsi[lengthrsi](close)mab = average[lengthrsipl](r)mbb = average[lengthtradesl](r)yellowMA = average[5](TypicalPrice)yellowMAshifted = yellowMA[2]//screener conditionslongCondition = mab crosses over mbb AND mab<=lowerzone AND xHigh>yellowMAshiftedshortCondition = mab crosses under mbb AND mab>=upperzone AND xLow<yellowMAshiftedSCREENER [longCondition OR shortCondition]You can adapt the “upperzone” and “lowerzone” levels for more or less restrictive rules.
04/18/2016 at 1:23 AM #5541Thanks for posting this Nicolas.
I have previously looked at this strategy with interest. At the moment I’m particularly interested in the Range Factor indicator used in the advanced part of this system. Used to identify when market in ranging, I’ve been trying to create a similar indicator in prorealtime with mixed success. Would you have any ideas/thoughts on how this indicator is created, thanks in advance.
04/18/2016 at 8:07 AM #554604/18/2016 at 12:56 PM #5579Hi Nicolas,
I’ve attached an mq4 file of the range factor indicator….hope this helps. It’s purpose is to indicate when a market is inactive, choppy or price range is tight. Like the TDI strategy I’m working on a trend following strategy and would like to add a filter that can remove these periods along with false entry signals.
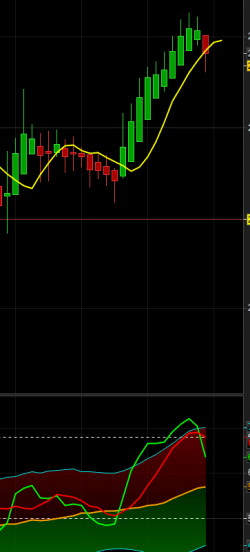
04/18/2016 at 2:10 PM #558504/18/2016 at 2:30 PM #558805/06/2016 at 4:35 PM #652205/06/2016 at 7:18 PM #652905/07/2016 at 2:43 PM #655405/07/2016 at 5:45 PM #655906/08/2016 at 12:00 PM #904306/08/2016 at 12:16 PM #904406/08/2016 at 12:57 PM #9045I have a list with some pairs and some index and i tested all the time frames available for a screeener but my problem is that i’m not able to show Heikin Ashi and the complete chart template as per your above example:-), i mean: the problem is mine, not of the code i think… 😉 many thanks, ciao! Fabio
06/08/2016 at 1:11 PM #9046You’ll need to install the indicators of this system if you want to see them on your chart. They are described in the first post:
_ price is Heiken Ashi style
_ Simple Moving Average, 5 periods, shifted 2 with typical price
_ the TDI indicator below, default configuration (see download link above in the indicators library)
But there are not needed for the screening purpose, since I embedded their code into the screener script.
-
AuthorPosts


