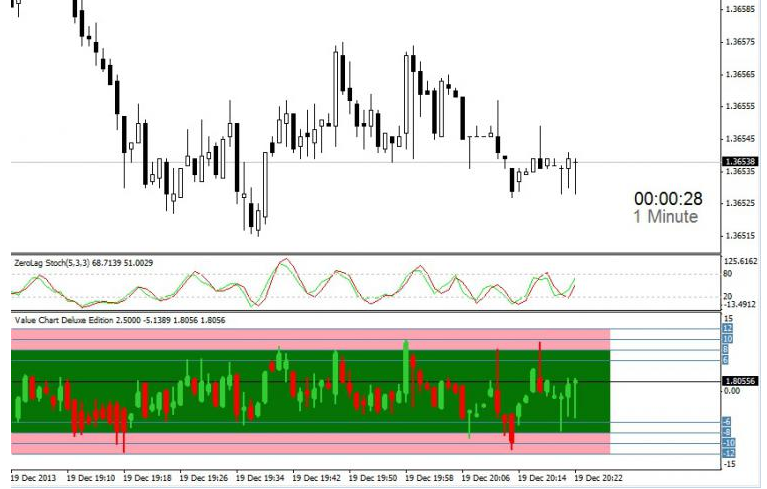
Hola Nicolás ,le traigo un nuevo indicador.:”A ver si es tan amable de traducirlo a Prorealtime.Gracias
#property copyright “Copyright 2013, William Kreider (Madhatt30)”
#property link “http://www.metaquotes.net”
#property indicator_separate_window
#property indicator_levelcolor SteelBlue
#property indicator_levelstyle 0
#propertyindicator_buffers 4
#property indicator_color1 Black
#property indicator_color2 Black
#property indicator_color3 Black
#property indicator_color4 Black
#property indicator_level1 12.0
#property indicator_level2 10.0
#property indicator_level3 8.0
#property indicator_level4 6
#property indicator_level5 – 6
#property indicator_level6 – 8.0
#property indicator_level7 – 10.0
#property indicator_level8 – 12
#property indicator_maximum 15
#property indicator_minimum – 15
extern int NumBars = 5 ; cadena
externa Note00 = “Verdadero = uso a través de iCustom” ; extern bool useExtern = false ; color externo Bullish_Color = LimeGreen; color externo Bearish_Color = Rojo; color externo Actual_Color = Amarillo; cadena extern
Note0 = “**** VC Bar Width ****” ;
extern int Wick = 2 ;
extern int Cuerpo = 6 ; Cadena
externa Note1 = “**** OB / OS Levels ****” ; extern int OBHigh_Upper = 12 ; extern int OBHigh_Lower = 8 ; extern int NMid_Upper = 8 ; extern int NMid_Lower = – 8 ; extern int OSLow_Upper = – 8 ; externo
int OSLow_Lower = – 12 ; cadena
externa Note1b = “barsback = Areas Displayed num bars back” ; extern int BarsBack = 1000 ; cadena externa Note1c = “BarsAhead = Áreas mostradas antes de la barra actual” ; extern int BarsAhead = 20 ; cadena externa Note2 = “**** OB / OS Level Colors ****” ; color externo OBHigh_Color = C’255,164,177 ‘ ; color externo Normal_Color = C’5,116,5 ‘
; color
externo OSLow_Color = C’255,164,177 ‘ ; cadena externa Note3 = “**** Configuración de alerta ****” ; extern bool useAlerts = false ; extern int NumLevels = 4 ; extern int level1 = 10 ; extern int level2 = – 10 ; extern int level3 = 11 ; extern int level4 = – 11 ; extern int level5 =
10 ;
extern int level6 = – 10 ;
extern double exitSig = 0.5 ; niveles
dobles [ 6 ];
bool en [ 6 ], firstrun = verdadero ;
double VOpen [], VHigh [], VLow [], VClose [], Typical;
int VCBars;
int winTF;
int barsback;
int init ()
{
SetIndexStyle ( 0 , DRAW_NONE );
SetIndexBuffer (0 , VHigh);
SetIndexStyle ( 1 , DRAW_NONE );
SetIndexBuffer ( 1 , VLow);
SetIndexStyle ( 2 , DRAW_NONE );
SetIndexBuffer ( 2 , VOpen);
SetIndexStyle ( 3 , DRAW_NONE );
SetIndexBuffer ( 3 , VClose);
winTF = Periodo ();
string shortname = “Value Chart Deluxe Edition (“ + winTF + “)” ;
IndicatorShortName (shortname);
niveles [0 ] = nivel1;
niveles [ 1 ] = nivel2;
niveles [ 2 ] = nivel3;
niveles [ 3 ] = nivel4;
niveles [ 4 ] = nivel5;
niveles [ 5 ] = nivel6;
para ( int i = 0 ; i <NumLevels; i ++)
{
en [i] = verdadero ;
}
firstrun = verdadero ;
barsback = ( Bars – Bars ) + BarsBack;
return ( 0 );
}
int deinit ()
{
ObjectsDeleteAll ( WindowFind ( “Value Chart Deluxe Edition (“ + winTF + “)” ));
firstrun = verdadero ;
return ( 0 );
}
int start ()
{
int curBar, ventana, cnt;
cuerdas mechas, cuerpos;
doble relativoCerrar;
winTF = Periodo ();
window = WindowFind ( “Value Chart Deluxe Edition (“ + winTF + “)” );
barsback = ( Bars – Bars ) + BarsBack;
int counted_bars = IndicatorCounted ();
Si(counted_bars < 0 ) return (- 1 );
if (counted_bars> 0 ) counted_bars–;
int limit = Bars -counted_bars;
if (counted_bars == 0 ) {patchExtBars ();}
if (counted_bars == 0 ) limit- = 1 + NumBars;
para ( int i = 0 ; i <= límite; i ++)
{
VOpen [i] = ( Abrir [i] – (MVA (NumBars, i))) / (ATR (NumBars, i));
VHigh [i] = ( Alto [i] – (MVA (NumBars, i))) / (ATR (NumBars, i));
VLow [i] = ( Bajo [i] – (MVA (NumBars, i))) / (ATR (NumBars, i));
VClose [i] = ( Cerrar [i] – (MVA (NumBars, i))) / (ATR (NumBars, i));
if (! useExtern)
{
curBar = limit-i;
if ( ObjectFind ( “TopRec1” )! = 0 )
{
if (barsback == 0 )
{
ObjectCreate ( “TopRec1” , OBJ_RECTANGLE , ventana,Time [ WindowBarsPerChart ()], OBHigh_Upper, ( Time [ 0 ] + (( Period () * 60 ) * BarsAhead)), OBHigh_Lower);
} else {
ObjectCreate ( “TopRec1” , OBJ_RECTANGLE , ventana, Hora [barsback], OBHigh_Upper, ( Hora [ 0 ] + (( Period () * 60 ) * BarsAhead)), OBHigh_Lower);
}
}
ObjectSet ( “TopRec1” , OBJPROP_COLOR , OBHigh_Color);
ObjectSet (“TopRec1” , OBJPROP_TIME1 , Tiempo [barsback]);
ObjectSet ( “TopRec1” , OBJPROP_TIME2 , ( Tiempo [ 0 ] + (( Período () * 60 ) * BarsAhead)));
ObjectSet ( “TopRec1” , OBJPROP_PRICE1 , OBHigh_Upper);
ObjectSet ( “TopRec1” , OBJPROP_PRICE2 , OBHigh_Lower);
if ( ObjectFind ( “MidRec1” )! = 0 )
{
if (barsback == 0)
{
ObjectCreate ( “MidRec1” , OBJ_RECTANGLE , ventana, Hora [ WindowBarsPerChart ()], NMid_Upper, ( Hora [ 0 ] + (( Período () * 60 ) * BarsAhead)), NMid_Lower);
} else {
ObjectCreate ( “MidRec1” , OBJ_RECTANGLE , ventana, Hora [barsback], NMid_Upper, ( Hora [ 0 ] + (( Período () * 60 ) * BarsAhead)), NMid_Lower);
}
}
ObjectSet ( “MidRec1” , OBJPROP_COLOR , Normal_Color);
ObjectSet ( “MidRec1” , OBJPROP_TIME1 , Time [barsback]);
ObjectSet ( “MidRec1” , OBJPROP_TIME2 , ( Tiempo [ 0 ] + (( Período () * 60 ) * BarsAhead)));
ObjectSet ( “MidRec1” , OBJPROP_PRICE1 , NMid_Upper);
ObjectSet ( “MidRec1” , OBJPROP_PRICE2 , NMid_Lower);
if ( ObjectFind( “BotRec2” )! = 0 )
{
if (barsback == 0 )
{
ObjectCreate ( “BotRec2” , OBJ_RECTANGLE , ventana, Tiempo [ WindowBarsPerChart ()], OSLow_Lower, ( Tiempo [ 0 ] + (( Period () * 60 ) * BarsAhead)), OSLow_Upper);
} else {
ObjectCreate ( “BotRec2” , OBJ_RECTANGLE , ventana, Hora [barsback], OSLow_Lower, ( Hora [ 0] + (( Period () * 60 ) * BarsAhead)), OSLow_Upper);
}
}
ObjectSet ( “BotRec2” , OBJPROP_COLOR , OSLow_Color);
ObjectSet ( “BotRec2” , OBJPROP_TIME1 , Tiempo [barsback]);
ObjectSet ( “BotRec2” , OBJPROP_TIME2 , ( Tiempo [ 0 ] + (( Período () * 60 ) * BarsAhead)));
ObjectSet ( “BotRec2” , OBJPROP_PRICE1 , OSLow_Lower);
ObjectSet (“BotRec2” , OBJPROP_PRICE2 , OSLow_Upper);
Wicks = “VC_HL_” + curBar;
créelo
if ( ObjectFind (Wicks)! = 0 )
{
ObjectCreate (Wicks, OBJ_TREND , ventana, Hora [i], VHigh [i], Tiempo [i], VLow [i]);
}
ObjectSet (Wicks, OBJPROP_STYLE ,STYLE_SOLID );
ObjectSet (Wicks, OBJPROP_RAY , FALSE );
ObjectSet (Wicks, OBJPROP_WIDTH , Wick);
ObjectSet (Wicks, OBJPROP_TIME1 , Time [i]);
ObjectSet (Wicks, OBJPROP_PRICE1 , VHigh [i]);
ObjectSet (Wicks, OBJPROP_TIME2 , Time [i]);
ObjectSet (Wicks, OBJPROP_PRICE2 , VLow [i]);
Cuerpos = “VC_OC_” + curBar;
if ( ObjectFind (Cuerpos)! = 0 )
{
ObjectCreate (cuerpos, OBJ_TREND , ventana, tiempo [i], VOpen [i], tiempo [i], VClose [i]);
}
ObjectSet (cuerpos, OBJPROP_STYLE , STYLE_SOLID );
ObjectSet (cuerpos, OBJPROP_RAY , FALSE );
ObjectSet (cuerpos, OBJPROP_WIDTH , cuerpo);
ObjectSet (cuerpos, OBJPROP_TIME1 , tiempo [i]);
ObjectSet (cuerpos, OBJPROP_PRICE1 , VOpen [i]);
ObjectSet (cuerpos, OBJPROP_TIME2 , tiempo [i]);
ObjectSet (cuerpos, OBJPROP_PRICE2 , VClose [i]);
relativeClose = VClose [ 0 ];
if ( Abrir [i] <= Cerrar [i])
{
ObjectSet (Wicks, OBJPROP_COLOR , Bullish_Color);
ObjectSet (cuerpos, OBJPROP_COLOR , Bullish_Color);
} else {
ObjectSet (Wicks, OBJPROP_COLOR , Bearish_Color);
ObjectSet (cuerpos, OBJPROP_COLOR , Bearish_Color);
}
ObjectCreate (“VC_BarPrice” , OBJ_HLINE , ventana, 0 , VClose [ 0 ]);
ObjectSet ( “VC_BarPrice” , OBJPROP_COLOR , Actual_Color);
ObjectSet ( “VC_BarPrice” , OBJPROP_PRICE1 , relativeClose);
if (useAlerts)
{
for (cnt = 0 ; cnt <NumLevels; cnt ++)
{
double level = levels [cnt];
if (nivel> 0 )
{
if (relativeClose> = nivel && en [cnt] == falso)
{
en [cnt] = verdadero ; Señal de
alerta ( símbolo (), “(“ , período (), “mínimo”: tabla de valores por encima de “ , nivel “ , “ );
}
if (relativeClose <level-exitSig && in [cnt] == true )
{
en [cnt] = false ;
}
}
if (nivel < 0 )
{
if (relativeClose <= nivel && en [cnt] == falso )
{
en [cnt] = verdadero ; Señal de
alerta ( Símbolo (), “(“ , Período (), “mínimo”: tabla de valores debajo de “ , nivel, “! );
}
if (relativeClose> level + exitSig && in [cnt] == true )
{
in [cnt] = false ;
}
}
}
}
}
}
return ( 0 );
}
doble MVA ( int NumBars1, int CBar)
{ suma
doble , floatingAxis;
for ( int k = CBar; k <NumBars1 + CBar; k ++)
{
suma + = ( Alta [k] + Baja [k]) / 2.0 );
}
floatingAxis = (sum / NumBars1);
return (eje flotante);
}
double ATR ( int NumBars1, int CBar)
{ suma
doble , volitilityUnit;
para (int k = CBar; k <NumBars1 + CBar; k ++)
{
suma + = ( Alta [k] – Baja [k]);
}
volitilityUnit = ( 0.2 * (sum / NumBars1));
if (volitilityUnit == 0 || volitilityUnit == 0.0 )
{
volitilityUnit = 0.00000001 ;
}
return (volitilityUnit);
}
void patchExtBars ()
{
ObjectsDeleteAll ( WindowFind ( “Value Chart Deluxe Edition (“ + winTF +“)” ));
}