Bonjour à tous et principalement à Nicolas et Ivan qui font un superbe travail sur ce site.
Je voudrais traduire un code que je trouve très intéressant sur Tradingview. Je pense que ce serait un indicateur très utile à tous sur le site.
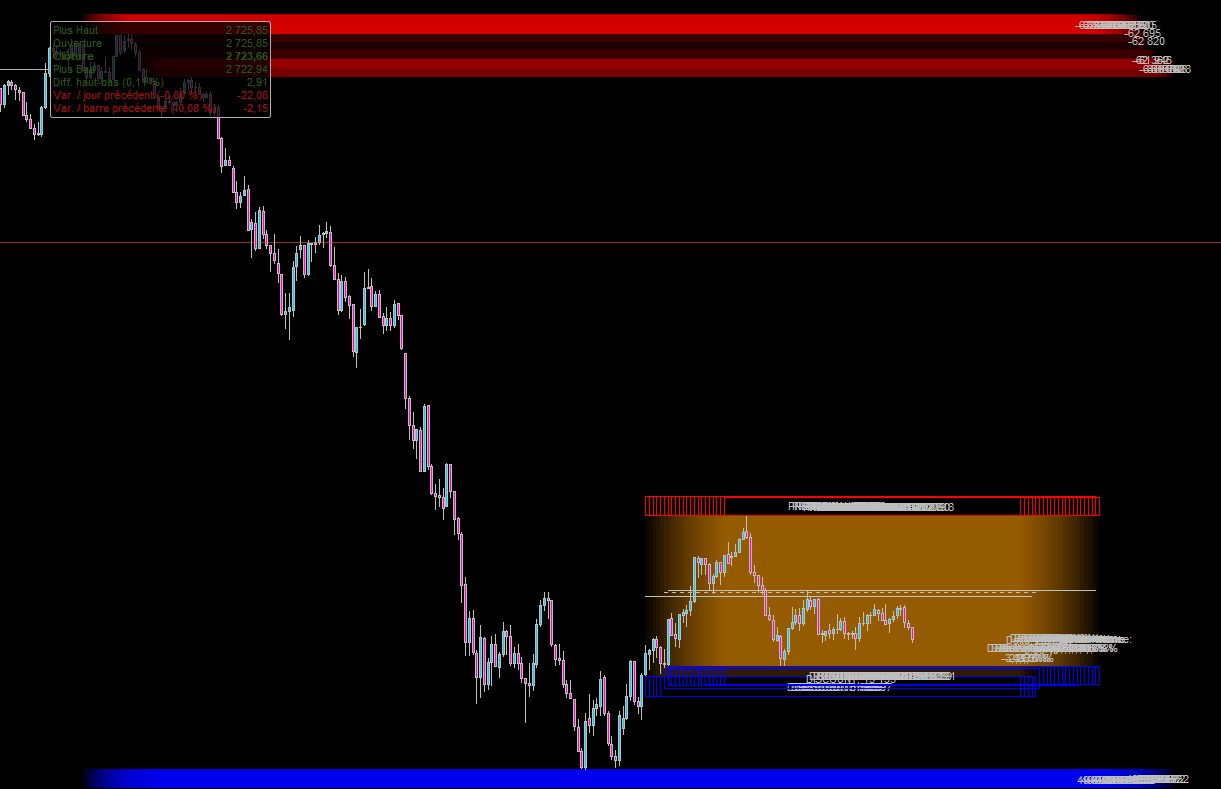
Cet indicateur permet d’identifier des zones discount et premium + des macro zones plus long terme.
Le détail du code est expliqué dans ce lien :
Ci-dessous le code en version pinescript :
// This work is licensed under Creative Commons Attribution-NonCommercial-ShareAlike 4.0 International
// © BigBeluga

//@version=5
indicator("Premium & Discount Delta Volume [BigBeluga]",
             overlay = true, max_lines_count = 2, max_boxes_count = 3)

// INPUTS --------------------------------------------------------------------------------------------------------------
// @variable: Toggle to show Support and Resistance levels
bool showSR      = input.bool(true, "", inline = "0")
// @variable: Lookback period for calculating Support and Resistance
int  srPeriod    = input.int(50, "Premium & Discount Lookback Period", minval = 10, step = 10, inline = "0",
                         tooltip = "Lookback period for Premium & Discount Levels with Delta Volume")
// @variable: Toggle to show macro High and Low levels
bool showMacro   = input.bool(true, "", inline = "1")
// @variable: Lookback period for calculating macro Highs and Lows
int  macroPeriod = input.int(200, "Macro Lookback Period", minval = 10, step = 10, inline = "1",
                             tooltip = "Lookback period for Macro Highs/Lows and Delta Volume")
// Color variables for trends
color upColor       = input.color(#79c1f1, "Discount", inline = "col", group = "Color")
color downColor     =  input.color(#f19579, "Premium", inline = "col", group = "Color")

// ARRAYS FOR STORING DATA ---------------------------------------------------------------------------------------------
// Arrays to store high/low data for S/R levels
var float[] srHighs     = array.new_float(srPeriod, 0.)
var float[] srLows      = array.new_float(srPeriod, 0.)
// Arrays to store high/low data for Macro levels
var float[] macroHighs  = array.new_float(macroPeriod, 0.)
var float[] macroLows   = array.new_float(macroPeriod, 0.)
// Arrays to store delta volume data
var float[] posVolSR    = array.new_float(srPeriod, 0.)
var float[] negVolSR    = array.new_float(srPeriod, 0.)
var float[] posVolMacro = array.new_float(macroPeriod, 0.)
var float[] negVolMacro = array.new_float(macroPeriod, 0.)

// VARIABLES FOR DELTA VOLUME CALCULATIONS -----------------------------------------------------------------------------
// Variables to store delta volume percentages for S/R and Macro periods
var float deltaVolSR    = na
var float deltaVolMacro = na

// VARIABLES FOR BOX DRAWING --------------------------------------------------------------------------------------------
// Variables for box indices for both S/R and Macro periods
int srStartIdx      = bar_index - srPeriod
int srEndIdx        = bar_index + 50
int macroStartIdx   = bar_index - macroPeriod
int macroEndIdx     = bar_index + 70

// Variables for box drawing
var box srUpperBox      = na
var box srLowerBox      = na
var box macroUpperBox   = na
var box macroLowerBox   = na
var box midBox          = na


// ATR for box scaling
float atrValue = ta.atr(200)*0.8

// VOLUME DELTA CALCULATIONS -------------------------------------------------------------------------------------------
// @description: Calculate the delta volume for Macro period
if barstate.islast and showMacro
    for int i = 0 to macroPeriod - 1
        array.push(macroHighs, high[i])
        array.push(macroLows, low[i])
        // Store positive and negative volume based on candle direction
        if close[i] > open[i]
            posVolMacro.set(i, volume[i])
        if close[i] < open[i]
            negVolMacro.set(i, -volume[i])
    // Calculate Macro Delta Volume
    deltaVolMacro := (negVolMacro.avg() / posVolMacro.avg() + 1) * 100
    deltaVolMacro := math.min(math.max(deltaVolMacro, -100), 100)  // Cap delta volume between -100 and 100

// Calculate the delta volume for S/R period
if barstate.islast and showSR
    for int i = 0 to srPeriod - 1
        array.push(srHighs, high[i])
        array.push(srLows, low[i])
        // Store positive and negative volume based on candle direction
        if close[i] > open[i]
            posVolSR.set(i, volume[i])
        if close[i] < open[i]
            negVolSR.set(i, -volume[i])
    // Calculate S/R Delta Volume
    deltaVolSR := (negVolSR.avg() / posVolSR.avg() + 1) * 100
    deltaVolSR := math.min(math.max(deltaVolSR, -100), 100)  // Cap delta volume between -100 and 100

// BOX HANDLING AND UPDATING -------------------------------------------------------------------------------------------
// Update and manage boxes based on crossover conditions
if ta.crossover(low, srUpperBox.get_top()) or ta.crossunder(high, srLowerBox.get_bottom()) or bar_index % 100 == 0
    // Set new bounds for S/R and Macro boxes
    srUpperBox.set_top(srHighs.max() + atrValue)
    srUpperBox.set_bottom(srHighs.min())
    srLowerBox.set_top(srLows.min())
    srLowerBox.set_bottom(srLows.min() - atrValue)

    macroUpperBox.set_top(macroHighs.max() + atrValue)
    macroUpperBox.set_bottom(macroHighs.min())
    macroLowerBox.set_top(macroLows.min())
    macroLowerBox.set_bottom(macroLows.min() - atrValue)

    // Delete previous boxes
    box.delete(srUpperBox[1])
    box.delete(srLowerBox[1])
    box.delete(macroUpperBox[1])
    box.delete(macroLowerBox[1])

// DRAW AND UPDATE BOXES ------------------------------------------------------------------------------------------------
// Draw and update lower box if not initialized for S/R period
if na(srLowerBox) and barstate.islast and showSR
    srLowerBox := box.new(srStartIdx, srLows.min(), srEndIdx, srLows.min() - atrValue,
                          upColor, 1,
                          bgcolor   = color.new(upColor, 100),
                          text      = "DISCOUNT: " + str.tostring(posVolSR.sum(), format.volume),
                          text_size = size.small,
                          text_color= chart.fg_color, force_overlay = true)
else
    srLowerBox.set_text("DISCOUNT: " + str.tostring(posVolSR.sum(), format.volume))
    box.set_left(srLowerBox, srStartIdx)
    box.set_right(srLowerBox, srEndIdx)
    array.clear(srLows)

// Draw and update upper box if not initialized for S/R period
if na(srUpperBox) and barstate.islast and showSR
    srUpperBox := box.new(srStartIdx, srHighs.max() + atrValue, srEndIdx, srHighs.max(),
                          downColor, 1,
                          bgcolor   = color.new(downColor, 100),
                          text      = "PREMIUM: " + str.tostring(negVolSR.sum(), format.volume),
                          text_size = size.small,
                          text_color= chart.fg_color, force_overlay = true)
else
    srUpperBox.set_text("PREMIUM: " + str.tostring(negVolSR.sum(), format.volume))
    box.set_left(srUpperBox, srStartIdx)
    box.set_right(srUpperBox, srEndIdx)
    array.clear(srHighs)

// DRAW BOXES FOR MACRO PERIOD ------------------------------------------------------------------------------------------
// Draw and update upper box for Macro period
if na(macroUpperBox) and barstate.islast and showMacro
    macroUpperBox := box.new(
                             macroStartIdx, macroHighs.max() + atrValue, macroEndIdx, macroHighs.max(),
                             downColor, 0,
                             bgcolor    = color.new(downColor, 60),
                             text       = str.tostring(negVolMacro.sum(), format.volume),
                             text_size  = size.small,
                             text_color = chart.fg_color,
                             text_halign= showSR ? text.align_right : text.align_center
                             )
else
    macroUpperBox.set_text(str.tostring(negVolMacro.sum(), format.volume))
    box.set_left(macroUpperBox, macroStartIdx)
    box.set_right(macroUpperBox, macroEndIdx)
    array.clear(macroHighs)

// Draw and update lower box for Macro period
if na(macroLowerBox) and barstate.islast and showMacro
    macroLowerBox := box.new(
                             macroStartIdx, macroLows.min(), macroEndIdx, macroLows.min() - atrValue,
                             upColor, 0,
                             bgcolor    = color.new(upColor, 60),
                             text       = str.tostring(posVolMacro.sum(), format.volume),
                             text_size  = size.small,
                             text_color = chart.fg_color,
                             text_halign= showSR ? text.align_right : text.align_center
                             )
else
    macroLowerBox.set_text(str.tostring(posVolMacro.sum(), format.volume))
    box.set_left(macroLowerBox, macroStartIdx)
    box.set_right(macroLowerBox, macroEndIdx)
    array.clear(macroLows)

// ADDITIONAL PLOTTING --------------------------------------------------------------------------------------------------
// Draw line for equilibrium and box for delta volume display
if barstate.islast and showSR
    float mid = math.avg(srLowerBox.get_top(), srUpperBox.get_bottom())
    line.delete(line.new(srStartIdx, mid, srEndIdx, mid, color=chart.fg_color, style=line.style_dashed)[1])

    midBox := box.new(srStartIdx, srUpperBox.get_bottom(), srEndIdx, srLowerBox.get_top(),
                      na, 0,
                      bgcolor       = color.new(deltaVolSR > 0 ? upColor : downColor, 93),
                      text          = "Delta Volume\n" + str.tostring(deltaVolSR, format.percent),
                      text_size     = size.normal, text_color=deltaVolSR > 0 ? upColor : downColor,
                      text_halign   = text.align_right, text_valign=text.align_bottom)

    box.delete(midBox[1])

// If only macro levels are shown, handle box and line drawing
if not showSR and showMacro and barstate.islast
    float midMacro = math.avg(macroLowerBox.get_top(), macroUpperBox.get_bottom())
    line.delete(line.new(macroStartIdx, midMacro, macroEndIdx, midMacro,
                         color=chart.fg_color, style=line.style_dashed)[1])

// Display Macro Delta Volume as a table
if showMacro and barstate.islast
    var table deltaTable = table.new(position.top_right, 5, 5)
    table.cell(deltaTable, 0, 0,
               text         = "Macro\n Delta Volume:\n" + str.tostring(deltaVolMacro, format.percent),
               text_color   = deltaVolMacro > 0 ? upColor : downColor,
               text_size    = size.large)