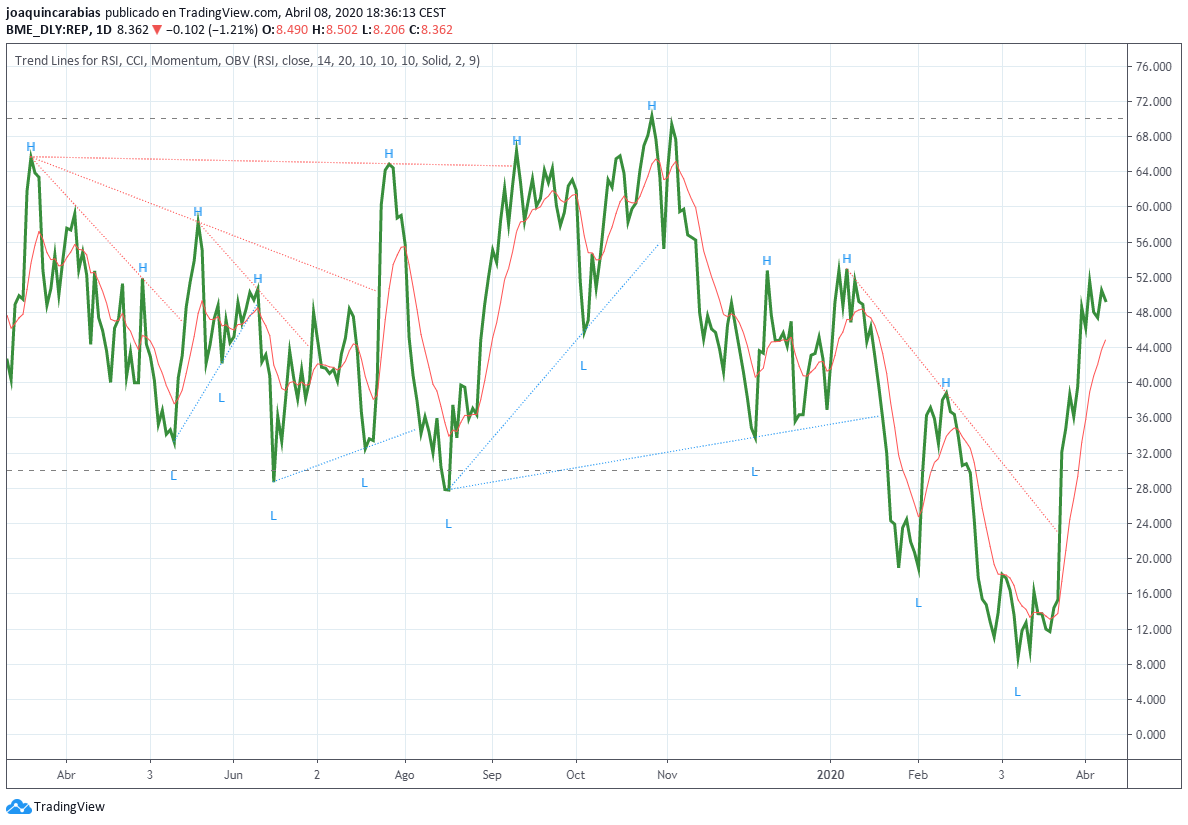
Hola quisiera que me pudieran codificar este indicador de tradingview para prorealtime, es un poco largo
// This source code is subject to the terms of the Mozilla Public License 2.0 at https://mozilla.org/MPL/2.0/
// © LonesomeTheBlue
//@version=4
study(“Trend Lines for RSI, CCI, Momentum, OBV”, overlay=false, max_bars_back = 4000)
indi = input(defval = ‘RSI’, title = ‘Indicator’, options = [‘RSI’, ‘CCI’, ‘OBV’, ‘Momentum’])
Src = input(defval = close, title=”Source”)
rsilen = input(defval = 14, title=”RSI Length”, minval = 1)
ccilen = input(defval = 20, title=”CCI Length”, minval = 1)
momlen = input(defval = 10, title=”Momentum Length”, minval = 1)
prd = input(defval = 10, title=”Pivot Point Period”, minval = 5, maxval = 50)
PPnum = input(defval = 10, title=”Number of Pivot Point to check”, minval = 2, maxval = 10)
linestylei= input(defval = ‘Solid’, title = “Line Style”, options =[‘Solid’, ‘Dashed’])
linewidth = input(defval = 2, title = “Line Width”, minval = 1, maxval = 4)
showbroken = input(defval = true, title=”Show Broken Trend Lines “)
extendlines = input(defval = false, title=”Extend Lines”)
showpivot = input(defval = false, title=”Show Pivot Points”)
showema = input(defval = false, title=”Show EMA line”)
emalen = input(defval = 9, title = “EMA Length”, minval = 1)
Rsi = rsi(Src, rsilen)
Cci = cci(Src, ccilen)
Mom = cci(Src, momlen)
src = indi == ‘RSI’ ? Rsi :
indi == ‘CCI’ ? Cci :
indi == ‘Momentum’ ? Mom :
obv
Emaline = showema ? ema(src, emalen) : na
hline1 = indi == ‘RSI’ ? 70 :
indi == ‘CCI’ ? 100 : na
hline2 = indi == ‘RSI’ ? 30 :
indi == ‘CCI’ ? -100 : na
h1 = hline(hline1)
h2 = hline(hline2)
fill(h1, h2, color = #9915ff, transp = 90)
plot(src, color = color.blue, linewidth = 2, transp = 0)
plot(Emaline, color = showema ? color.red : na, linewidth = 1, transp = 0)
float ph = na, float pl = na
ph := pivothigh(src, prd, prd)
pl := pivotlow(src, prd, prd)
plotshape(ph and showpivot ? ph : na, text=”H”, style=shape.labeldown, color=na, textcolor=color.blue, location=location.absolute, transp=0, offset = -prd)
plotshape(pl and showpivot ? pl – 5 : na, text=”L”, style=shape.labeldown, color=na, textcolor=color.blue, location=location.absolute, transp=0, offset = -prd)
getloc(bar_i)=>
_ret = bar_index + prd – bar_i
//get last 10 pivot highs – (hope to have Array in Pine version 5)
t1pos = valuewhen(ph, bar_index, 0)
t1val = nz(src[getloc(t1pos)])
t2pos = valuewhen(ph, bar_index, 1)
t2val = nz(src[getloc(t2pos)])
t3pos = valuewhen(ph, bar_index, 2)
t3val = nz(src[getloc(t3pos)])
t4pos = valuewhen(ph, bar_index, 3)
t4val = nz(src[getloc(t4pos)])
t5pos = valuewhen(ph, bar_index, 4)
t5val = nz(src[getloc(t5pos)])
t6pos = valuewhen(ph, bar_index, 5)
t6val = nz(src[getloc(t6pos)])
t7pos = valuewhen(ph, bar_index, 6)
t7val = nz(src[getloc(t7pos)])
t8pos = valuewhen(ph, bar_index, 7)
t8val = nz(src[getloc(t8pos)])
t9pos = valuewhen(ph, bar_index, 8)
t9val = nz(src[getloc(t9pos)])
t10pos = valuewhen(ph, bar_index, 9)
t10val = nz(src[getloc(t10pos)])
//get last 10 pivot lows
b1pos = valuewhen(pl, bar_index, 0)
b1val = nz(src[getloc(b1pos)])
b2pos = valuewhen(pl, bar_index, 1)
b2val = nz(src[getloc(b2pos)])
b3pos = valuewhen(pl, bar_index, 2)
b3val = nz(src[getloc(b3pos)])
b4pos = valuewhen(pl, bar_index, 3)
b4val = nz(src[getloc(b4pos)])
b5pos = valuewhen(pl, bar_index, 4)
b5val = nz(src[getloc(b5pos)])
b6pos = valuewhen(pl, bar_index, 5)
b6val = nz(src[getloc(b6pos)])
b7pos = valuewhen(pl, bar_index, 6)
b7val = nz(src[getloc(b7pos)])
b8pos = valuewhen(pl, bar_index, 7)
b8val = nz(src[getloc(b8pos)])
b9pos = valuewhen(pl, bar_index, 8)
b9val = nz(src[getloc(b9pos)])
b10pos = valuewhen(pl, bar_index, 9)
b10val = nz(src[getloc(b10pos)])
getloval(l1, l2)=>
_ret1 = l1 == 1 ? b1val : l1 == 2 ? b2val : l1 ==3 ? b3val : l1 == 4 ? b4val : l1 == 5 ? b5val : l1 == 6 ? b6val : l1 == 7 ? b7val : l1 == 8 ? b8val : l1 == 9 ? b9val : l1 == 10 ? b10val : 0
_ret2 = l2 == 1 ? b1val : l2 == 2 ? b2val : l2 ==3 ? b3val : l2 == 4 ? b4val : l2 == 5 ? b5val : l2 == 6 ? b6val : l2 == 7 ? b7val : l2 == 8 ? b8val : l2 == 9 ? b9val : l2 == 10 ? b10val : 0
[_ret1, _ret2]
getlopos(l1, l2)=>
_ret1 = l1 == 1 ? b1pos : l1 == 2 ? b2pos : l1 ==3 ? b3pos : l1 == 4 ? b4pos : l1 == 5 ? b5pos : l1 == 6 ? b6pos : l1 == 7 ? b7pos : l1 == 8 ? b8pos : l1 == 9 ? b9pos : l1 == 10 ? b10pos : 0
_ret2 = l2 == 1 ? b1pos : l2 == 2 ? b2pos : l2 ==3 ? b3pos : l2 == 4 ? b4pos : l2 == 5 ? b5pos : l2 == 6 ? b6pos : l2 == 7 ? b7pos : l2 == 8 ? b8pos : l2 == 9 ? b9pos : l2 == 10 ? b10pos : 0
[_ret1, _ret2]
gethival(l1, l2)=>
_ret1 = l1 == 1 ? t1val : l1 == 2 ? t2val : l1 ==3 ? t3val : l1 == 4 ? t4val : l1 == 5 ? t5val : l1 == 6 ? t6val : l1 == 7 ? t7val : l1 == 8 ? t8val : l1 == 9 ? t9val : l1 == 10 ? t10val : 0
_ret2 = l2 == 1 ? t1val : l2 == 2 ? t2val : l2 ==3 ? t3val : l2 == 4 ? t4val : l2 == 5 ? t5val : l2 == 6 ? t6val : l2 == 7 ? t7val : l2 == 8 ? t8val : l2 == 9 ? t9val : l2 == 10 ? t10val : 0
[_ret1, _ret2]
gethipos(l1, l2)=>
_ret1 = l1 == 1 ? t1pos : l1 == 2 ? t2pos : l1 ==3 ? t3pos : l1 == 4 ? t4pos : l1 == 5 ? t5pos : l1 == 6 ? t6pos : l1 == 7 ? t7pos : l1 == 8 ? t8pos : l1 == 9 ? t9pos : l1 == 10 ? t10pos : 0
_ret2 = l2 == 1 ? t1pos : l2 == 2 ? t2pos : l2 ==3 ? t3pos : l2 == 4 ? t4pos : l2 == 5 ? t5pos : l2 == 6 ? t6pos : l2 == 7 ? t7pos : l2 == 8 ? t8pos : l2 == 9 ? t9pos : l2 == 10 ? t10pos : 0
[_ret1, _ret2]
// line definitions
var line l1 = na, var line l2 = na, var line l3 = na, var line l4 = na, var line l5 = na, var line l6 = na, var line l7 = na, var line l8 = na, var line l9 = na, var line l10 = na
var line l11 = na, var line l12 = na, var line l13 = na, var line l14 = na, var line l15 = na, var line l16 = na, var line l17 = na, var line l18 = na, var line l19 = na, var line l20 = na
var line t1 = na, var line t2 = na, var line t3 = na, var line t4 = na, var line t5 = na, var line t6 = na, var line t7 = na, var line t8 = na, var line t9 = na, var line t10 = na
var line t11 = na, var line t12 = na, var line t13 = na, var line t14 = na, var line t15 = na, var line t16 = na, var line t17 = na, var line t18 = na, var line t19 = na, var line t20 = na
//delete old lines
line.delete(l1), line.delete(l2), line.delete(l3), line.delete(l4), line.delete(l5), line.delete(l6), line.delete(l7), line.delete(l8), line.delete(l9), line.delete(l10)
line.delete(l11), line.delete(l12), line.delete(l13), line.delete(l14), line.delete(l15), line.delete(l16), line.delete(l17), line.delete(l18), line.delete(l19), line.delete(l20)
line.delete(t1), line.delete(t2), line.delete(t3), line.delete(t4), line.delete(t5), line.delete(t6), line.delete(t7), line.delete(t8), line.delete(t9), line.delete(t10)
line.delete(t11), line.delete(t12), line.delete(t13), line.delete(t14), line.delete(t15), line.delete(t16), line.delete(t17), line.delete(t18), line.delete(t19), line.delete(t20)
// there is limitation for number of lines on chart (<=50), and we use 20 uptrend lines + 20 downtrend lines (total 40)
maxline = 20
//Line coloring
ulcolor = color.red
dlcolor = color.blue
//Line style
linestyle = linestylei == 'Solid' ? line.style_solid : line.style_dashed
brokenstyle = line.style_dotted
// extend lines
extln = extendlines ? extend.right : extend.none
// loop for pivot points to check if there is possible trend line
countlinelo = 0
countlinehi = 0
for p1 = 1 to PPnum - 1
uv1 = 0.0
uv2 = 0.0
up1 = 0
up2 = 0
if countlinelo <= maxline
for p2 = PPnum to p1 + 1
[val1, val2] = getloval(p1, p2)
[pos1, pos2] = getlopos(p1, p2)
if val1 > val2
diff = (val1 – val2) / (pos1 – pos2)
hline = val2 + diff
lloc = bar_index
lval = src
valid = true
brokentrend = false
for x = pos2 + 1 – prd to bar_index
if nz(src[getloc(x + prd)]) < hline
valid := false
if x + prd >= pos1
brokentrend := true
break
lloc := x
lval := hline
hline := hline + diff
if valid
uv1 := hline
uv2 := val2
up1 := lloc
up2 := pos2
break
if showbroken and not valid and countlinelo < maxline and brokentrend
countlinelo := countlinelo + 1
l1 := countlinelo == 1 ? line.new(pos2 - prd, val2, lloc, lval, style = brokenstyle, color = dlcolor) : l1
l2 := countlinelo == 2 ? line.new(pos2 - prd, val2, lloc, lval, style = brokenstyle, color = dlcolor) : l2
l3 := countlinelo == 3 ? line.new(pos2 - prd, val2, lloc, lval, style = brokenstyle, color = dlcolor) : l3
l4 := countlinelo == 4 ? line.new(pos2 - prd, val2, lloc, lval, style = brokenstyle, color = dlcolor) : l4
l5 := countlinelo == 5 ? line.new(pos2 - prd, val2, lloc, lval, style = brokenstyle, color = dlcolor) : l5
l6 := countlinelo == 6 ? line.new(pos2 - prd, val2, lloc, lval, style = brokenstyle, color = dlcolor) : l6
l7 := countlinelo == 7 ? line.new(pos2 - prd, val2, lloc, lval, style = brokenstyle, color = dlcolor) : l7
l8 := countlinelo == 8 ? line.new(pos2 - prd, val2, lloc, lval, style = brokenstyle, color = dlcolor) : l8
l9 := countlinelo == 9 ? line.new(pos2 - prd, val2, lloc, lval, style = brokenstyle, color = dlcolor) : l9
l10 := countlinelo == 10 ? line.new(pos2 - prd, val2, lloc, lval, style = brokenstyle, color = dlcolor) : l10
l11 := countlinelo == 11 ? line.new(pos2 - prd, val2, lloc, lval, style = brokenstyle, color = dlcolor) : l11
l12 := countlinelo == 12 ? line.new(pos2 - prd, val2, lloc, lval, style = brokenstyle, color = dlcolor) : l12
l13 := countlinelo == 13 ? line.new(pos2 - prd, val2, lloc, lval, style = brokenstyle, color = dlcolor) : l13
l14 := countlinelo == 14 ? line.new(pos2 - prd, val2, lloc, lval, style = brokenstyle, color = dlcolor) : l14
l15 := countlinelo == 15 ? line.new(pos2 - prd, val2, lloc, lval, style = brokenstyle, color = dlcolor) : l15
l16 := countlinelo == 16 ? line.new(pos2 - prd, val2, lloc, lval, style = brokenstyle, color = dlcolor) : l16
l17 := countlinelo == 17 ? line.new(pos2 - prd, val2, lloc, lval, style = brokenstyle, color = dlcolor) : l17
l18 := countlinelo == 18 ? line.new(pos2 - prd, val2, lloc, lval, style = brokenstyle, color = dlcolor) : l18
l19 := countlinelo == 19 ? line.new(pos2 - prd, val2, lloc, lval, style = brokenstyle, color = dlcolor) : l19
l20 := countlinelo == 20 ? line.new(pos2 - prd, val2, lloc, lval, style = brokenstyle, color = dlcolor) : l20
dv1 = 0.0
dv2 = 0.0
dp1 = 0
dp2 = 0
if countlinehi <= maxline
for p2 = PPnum to p1 + 1
[val1, val2] = gethival(p1, p2)
[pos1, pos2] = gethipos(p1, p2)
if val1 < val2
diff = (val2 - val1) / (pos1 - pos2)
hline = val2 - diff
lloc = bar_index
lval = src
valid = true
brokentrend = false
for x = pos2 + 1 - prd to bar_index
if nz(src[getloc(x + prd)]) > hline
valid := false
if x + prd >= pos1
brokentrend := true
break
lloc := x
lval := hline
hline := hline – diff
if valid
dv1 := hline
dv2 := val2
dp1 := lloc
dp2 := pos2
break
if showbroken and not valid and countlinehi < maxline and brokentrend
countlinehi := countlinehi + 1
t1 := countlinehi == 1 ? line.new(pos2 - prd, val2, lloc, lval, style = brokenstyle, color = ulcolor) : t1
t2 := countlinehi == 2 ? line.new(pos2 - prd, val2, lloc, lval, style = brokenstyle, color = ulcolor) : t2
t3 := countlinehi == 3 ? line.new(pos2 - prd, val2, lloc, lval, style = brokenstyle, color = ulcolor) : t3
t4 := countlinehi == 4 ? line.new(pos2 - prd, val2, lloc, lval, style = brokenstyle, color = ulcolor) : t4
t5 := countlinehi == 5 ? line.new(pos2 - prd, val2, lloc, lval, style = brokenstyle, color = ulcolor) : t5
t6 := countlinehi == 6 ? line.new(pos2 - prd, val2, lloc, lval, style = brokenstyle, color = ulcolor) : t6
t7 := countlinehi == 7 ? line.new(pos2 - prd, val2, lloc, lval, style = brokenstyle, color = ulcolor) : t7
t8 := countlinehi == 8 ? line.new(pos2 - prd, val2, lloc, lval, style = brokenstyle, color = ulcolor) : t8
t9 := countlinehi == 9 ? line.new(pos2 - prd, val2, lloc, lval, style = brokenstyle, color = ulcolor) : t9
t10 := countlinehi == 10 ? line.new(pos2 - prd, val2, lloc, lval, style = brokenstyle, color = ulcolor) : t10
t11 := countlinehi == 11 ? line.new(pos2 - prd, val2, lloc, lval, style = brokenstyle, color = ulcolor) : t11
t12 := countlinehi == 12 ? line.new(pos2 - prd, val2, lloc, lval, style = brokenstyle, color = ulcolor) : t12
t13 := countlinehi == 13 ? line.new(pos2 - prd, val2, lloc, lval, style = brokenstyle, color = ulcolor) : t13
t14 := countlinehi == 14 ? line.new(pos2 - prd, val2, lloc, lval, style = brokenstyle, color = ulcolor) : t14
t15 := countlinehi == 15 ? line.new(pos2 - prd, val2, lloc, lval, style = brokenstyle, color = ulcolor) : t15
t16 := countlinehi == 16 ? line.new(pos2 - prd, val2, lloc, lval, style = brokenstyle, color = ulcolor) : t16
t17 := countlinehi == 17 ? line.new(pos2 - prd, val2, lloc, lval, style = brokenstyle, color = ulcolor) : t17
t18 := countlinehi == 18 ? line.new(pos2 - prd, val2, lloc, lval, style = brokenstyle, color = ulcolor) : t18
t19 := countlinehi == 19 ? line.new(pos2 - prd, val2, lloc, lval, style = brokenstyle, color = ulcolor) : t19
t20 := countlinehi == 20 ? line.new(pos2 - prd, val2, lloc, lval, style = brokenstyle, color = ulcolor) : t20
// if there is continues uptrend line then draw it
if up1 != 0 and up2 != 0 and countlinelo < maxline
countlinelo := countlinelo + 1
l1 := countlinelo == 1 ? line.new(up2 - prd, uv2, up1, uv1, style = linestyle, color = dlcolor, width = linewidth, extend = extln) : l1
l2 := countlinelo == 2 ? line.new(up2 - prd, uv2, up1, uv1, style = linestyle, color = dlcolor, width = linewidth, extend = extln) : l2
l3 := countlinelo == 3 ? line.new(up2 - prd, uv2, up1, uv1, style = linestyle, color = dlcolor, width = linewidth, extend = extln) : l3
l4 := countlinelo == 4 ? line.new(up2 - prd, uv2, up1, uv1, style = linestyle, color = dlcolor, width = linewidth, extend = extln) : l4
l5 := countlinelo == 5 ? line.new(up2 - prd, uv2, up1, uv1, style = linestyle, color = dlcolor, width = linewidth, extend = extln) : l5
l6 := countlinelo == 6 ? line.new(up2 - prd, uv2, up1, uv1, style = linestyle, color = dlcolor, width = linewidth, extend = extln) : l6
l7 := countlinelo == 7 ? line.new(up2 - prd, uv2, up1, uv1, style = linestyle, color = dlcolor, width = linewidth, extend = extln) : l7
l8 := countlinelo == 8 ? line.new(up2 - prd, uv2, up1, uv1, style = linestyle, color = dlcolor, width = linewidth, extend = extln) : l8
l9 := countlinelo == 9 ? line.new(up2 - prd, uv2, up1, uv1, style = linestyle, color = dlcolor, width = linewidth, extend = extln) : l9
l10 := countlinelo == 10 ? line.new(up2 - prd, uv2, up1, uv1, style = linestyle, color = dlcolor, width = linewidth, extend = extln) : l10
l11 := countlinelo == 11 ? line.new(up2 - prd, uv2, up1, uv1, style = linestyle, color = dlcolor, width = linewidth, extend = extln) : l11
l12 := countlinelo == 12 ? line.new(up2 - prd, uv2, up1, uv1, style = linestyle, color = dlcolor, width = linewidth, extend = extln) : l12
l13 := countlinelo == 13 ? line.new(up2 - prd, uv2, up1, uv1, style = linestyle, color = dlcolor, width = linewidth, extend = extln) : l13
l14 := countlinelo == 14 ? line.new(up2 - prd, uv2, up1, uv1, style = linestyle, color = dlcolor, width = linewidth, extend = extln) : l14
l15 := countlinelo == 15 ? line.new(up2 - prd, uv2, up1, uv1, style = linestyle, color = dlcolor, width = linewidth, extend = extln) : l15
l16 := countlinelo == 16 ? line.new(up2 - prd, uv2, up1, uv1, style = linestyle, color = dlcolor, width = linewidth, extend = extln) : l16
l17 := countlinelo == 17 ? line.new(up2 - prd, uv2, up1, uv1, style = linestyle, color = dlcolor, width = linewidth, extend = extln) : l17
l18 := countlinelo == 18 ? line.new(up2 - prd, uv2, up1, uv1, style = linestyle, color = dlcolor, width = linewidth, extend = extln) : l18
l19 := countlinelo == 19 ? line.new(up2 - prd, uv2, up1, uv1, style = linestyle, color = dlcolor, width = linewidth, extend = extln) : l19
l20 := countlinelo == 20 ? line.new(up2 - prd, uv2, up1, uv1, style = linestyle, color = dlcolor, width = linewidth, extend = extln) : l20
// if there is continues downtrend line then draw it
if dp1 != 0 and dp2 != 0 and countlinehi < maxline
countlinehi := countlinehi + 1
t1 := countlinehi == 1 ? line.new(dp2 - prd, dv2, dp1, dv1, style = linestyle, color = ulcolor, width = linewidth, extend = extln) : t1
t2 := countlinehi == 2 ? line.new(dp2 - prd, dv2, dp1, dv1, style = linestyle, color = ulcolor, width = linewidth, extend = extln) : t2
t3 := countlinehi == 3 ? line.new(dp2 - prd, dv2, dp1, dv1, style = linestyle, color = ulcolor, width = linewidth, extend = extln) : t3
t4 := countlinehi == 4 ? line.new(dp2 - prd, dv2, dp1, dv1, style = linestyle, color = ulcolor, width = linewidth, extend = extln) : t4
t5 := countlinehi == 5 ? line.new(dp2 - prd, dv2, dp1, dv1, style = linestyle, color = ulcolor, width = linewidth, extend = extln) : t5
t6 := countlinehi == 6 ? line.new(dp2 - prd, dv2, dp1, dv1, style = linestyle, color = ulcolor, width = linewidth, extend = extln) : t6
t7 := countlinehi == 7 ? line.new(dp2 - prd, dv2, dp1, dv1, style = linestyle, color = ulcolor, width = linewidth, extend = extln) : t7
t8 := countlinehi == 8 ? line.new(dp2 - prd, dv2, dp1, dv1, style = linestyle, color = ulcolor, width = linewidth, extend = extln) : t8
t9 := countlinehi == 9 ? line.new(dp2 - prd, dv2, dp1, dv1, style = linestyle, color = ulcolor, width = linewidth, extend = extln) : t9
t10 := countlinehi == 10 ? line.new(dp2 - prd, dv2, dp1, dv1, style = linestyle, color = ulcolor, width = linewidth, extend = extln) : t10
t11 := countlinehi == 11 ? line.new(dp2 - prd, dv2, dp1, dv1, style = linestyle, color = ulcolor, width = linewidth, extend = extln) : t11
t12 := countlinehi == 12 ? line.new(dp2 - prd, dv2, dp1, dv1, style = linestyle, color = ulcolor, width = linewidth, extend = extln) : t12
t13 := countlinehi == 13 ? line.new(dp2 - prd, dv2, dp1, dv1, style = linestyle, color = ulcolor, width = linewidth, extend = extln) : t13
t14 := countlinehi == 14 ? line.new(dp2 - prd, dv2, dp1, dv1, style = linestyle, color = ulcolor, width = linewidth, extend = extln) : t14
t15 := countlinehi == 15 ? line.new(dp2 - prd, dv2, dp1, dv1, style = linestyle, color = ulcolor, width = linewidth, extend = extln) : t15
t16 := countlinehi == 16 ? line.new(dp2 - prd, dv2, dp1, dv1, style = linestyle, color = ulcolor, width = linewidth, extend = extln) : t16
t17 := countlinehi == 17 ? line.new(dp2 - prd, dv2, dp1, dv1, style = linestyle, color = ulcolor, width = linewidth, extend = extln) : t17
t18 := countlinehi == 18 ? line.new(dp2 - prd, dv2, dp1, dv1, style = linestyle, color = ulcolor, width = linewidth, extend = extln) : t18
t19 := countlinehi == 19 ? line.new(dp2 - prd, dv2, dp1, dv1, style = linestyle, color = ulcolor, width = linewidth, extend = extln) : t19
t20 := countlinehi == 20 ? line.new(dp2 - prd, dv2, dp1, dv1, style = linestyle, color = ulcolor, width = linewidth, extend = extln) : t20