VDUB_Binary Startegy from TradingView

Viewing 4 posts - 1 through 4 (of 4 total)
  • Author
    Posts
  • #93919 quote
    kryomancer86kryomancer86
    Participant
    Veteran

    Hi there,

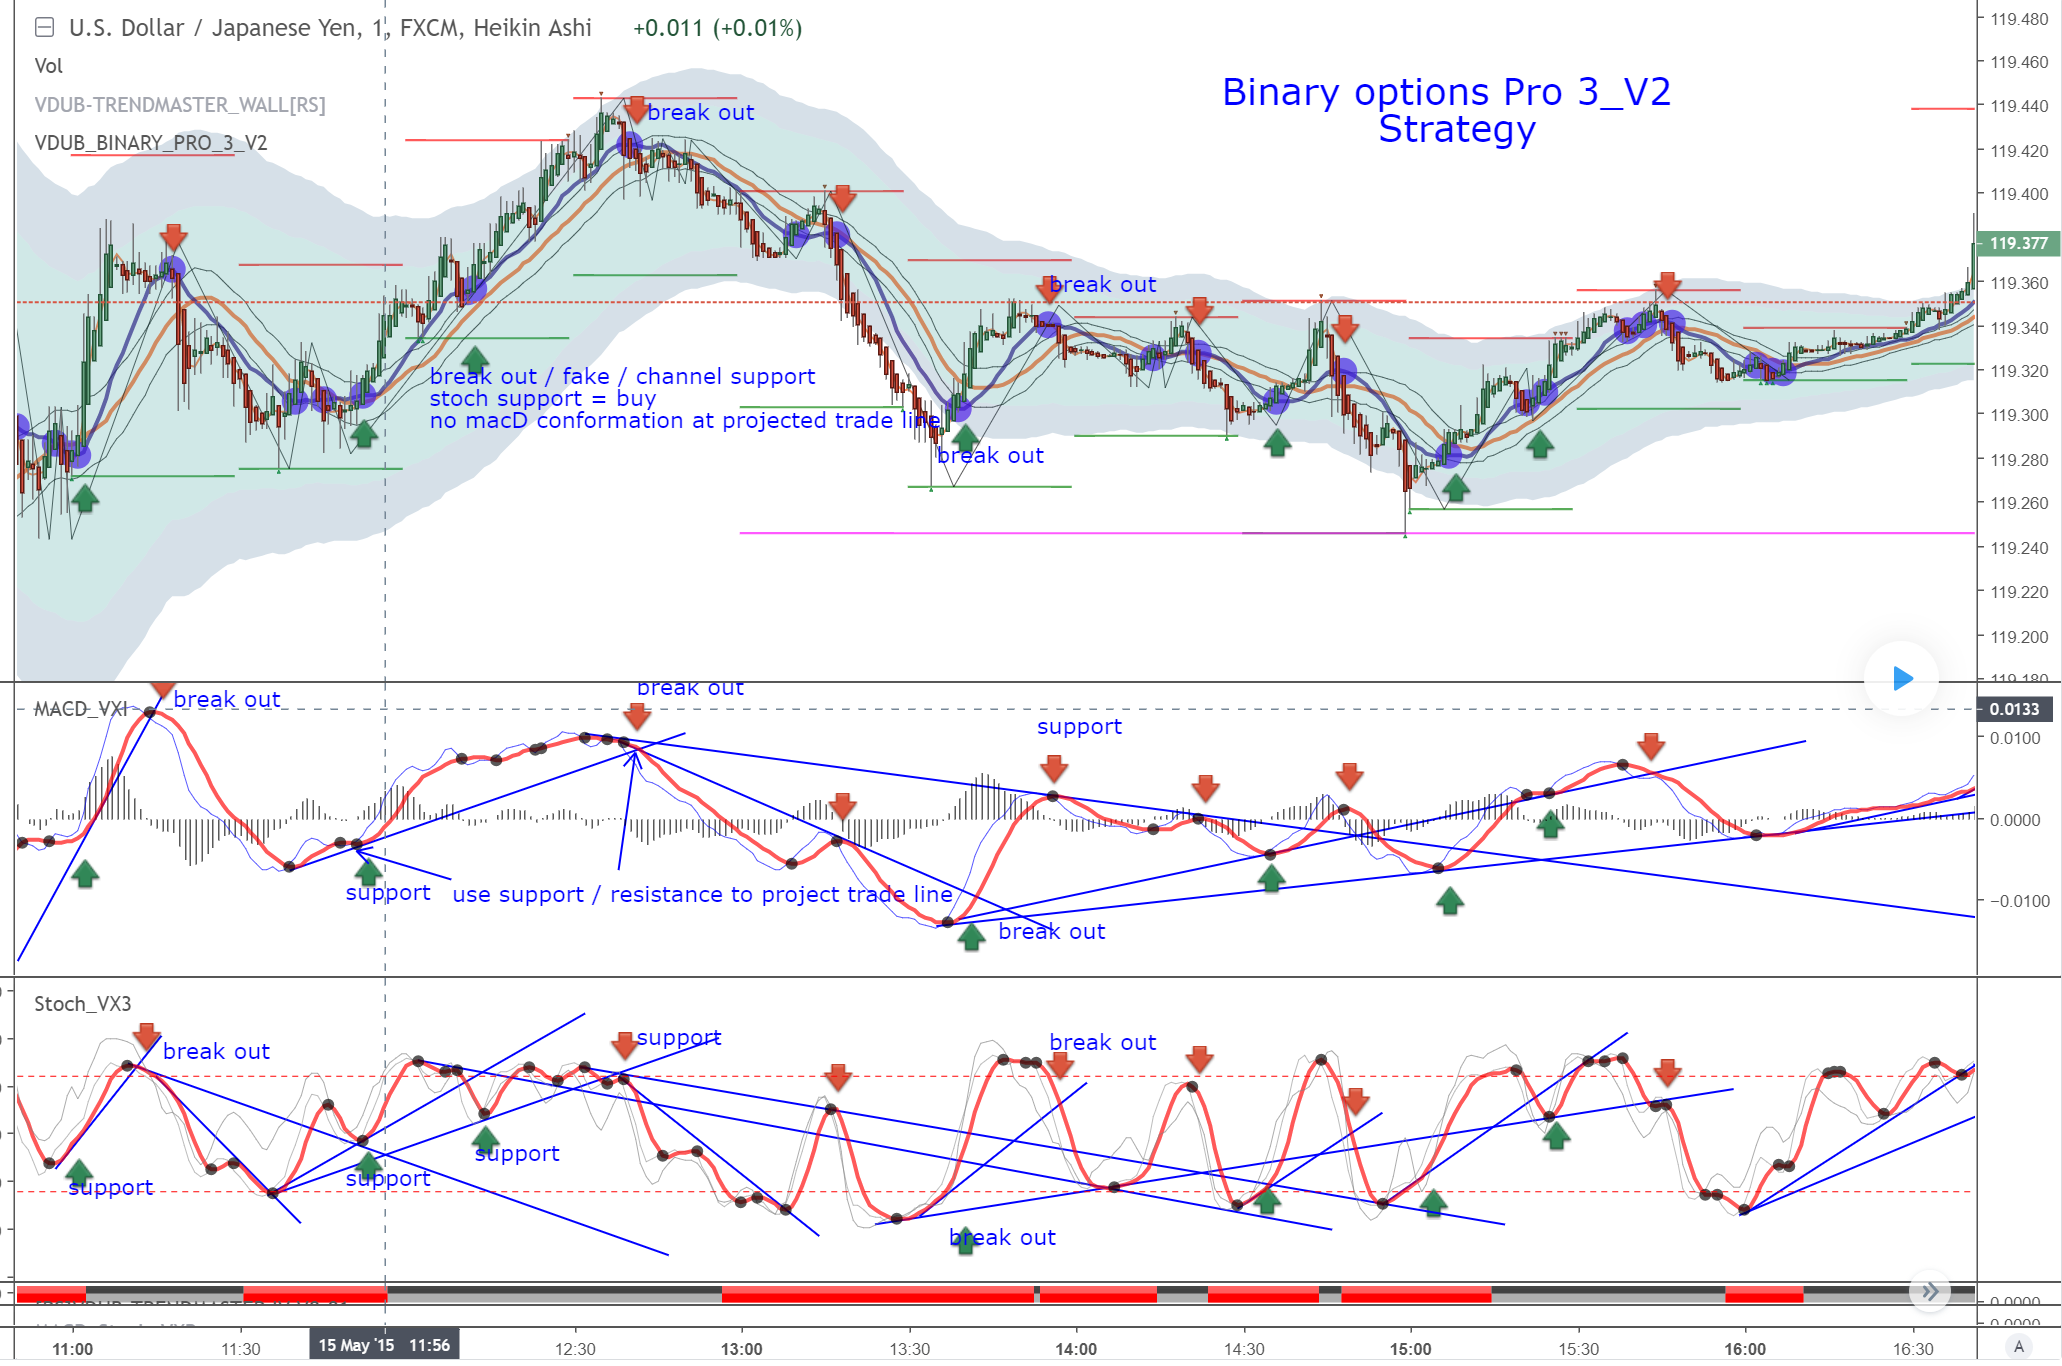
    I found this strategy on TradingView which has its own indicator as well. I was wondering if it’s possible to convert the code to PRT?

    This is the link to the code, not sure if I should post the whole code here.

    https://www.tradingview.com/script/Qeq1OFuM-VDUB-BINARY-PRO-3-V2-FINAL-Strategy/

    study(title="VDUB_BINARY_PRO_3_V2", shorttitle="VDUB_BINARY_PRO_3_V2", overlay=true)
    source = close
    length = input(56, minval=1, title = "WMA Length")
    atrlen = input(100, minval=1, title = "ATR Length")
    mult1 = 2
    mult2 = 3
    ma = wma(source, length)
    range =  tr
    rangema = wma(range, atrlen)
    
    up1 = ma + rangema * mult1
    up2 = ma + rangema * mult2
    
    dn1 = ma - rangema * mult1
    dn2 = ma - rangema * mult2
    
    color1 = white
    color2 = white
    
    u4 = plot(up1, color = color1)
    u8 = plot(up2, color = color2)
    
    d4 = plot(dn1, color = color1)
    d8 = plot(dn2, color = color2)
    
    fill(u8, u4, color=#30628E, transp=80)
    fill(d8, d4, color=#30628E, transp=80)
    fill(d4, u4, color=#128E89, transp=80)
    
    //Linear regression band
    src = close
    //Input
    nlookback = input (defval = 20, minval = 1, title = "Number of Lookback")
    scale = input(defval=1,  title="scale of ATR")
    nATR = input(defval = 14, title="ATR Parameter")
    
    //Center band
    periods=input(21, minval=1, title="MA Period")
    pc = input(true, title="MA BAND")
    
    hld = iff(close > sma(high,periods)[1], 1, iff(close<sma(low,periods)[1],-1, 0))
    hlv = valuewhen(hld != 0, hld, 1)
    
    hi = pc and hlv == -1 ? sma(high, periods) : na
    lo = pc and hlv == 1 ? sma(low,periods) : na
    plot(avg(sma(high,periods)+2.5*(sma(high,periods)-sma(low,periods)),sma(low,periods)-2.5*(sma(high,periods)-sma(low,periods))), color=red, style=line,linewidth=4)
    plot(pc and sma(high, periods) ? sma(high, periods):na ,title="Swing High Plot", color=black,style=line, linewidth=1)
    plot(pc and sma(low,periods) ? sma(low,periods) : na ,title="Swing Low Plot", color=black,style=line, linewidth=1)
    //fill(hlv,hld,color=#1c86ee,transp=80)
    //--------------------------------------------------------------------------------------------
    // Base line_VX1
    source2 = close
    short = sma(close, 3)
    long = sma(close, 13)
    plot(short, color=red, linewidth=2)
    plot(long, color=navy, linewidth=4)
    plot(cross(long, short) ? long : na, style = circles, color=blue, linewidth = 9)
    OutputSignal = long >= short ? 1 : 0
    bgcolor(OutputSignal>0?red:gray, transp=100)
    //=======================================================
    //Vdub_Tetris_V2
    LRG_Channel_TF_mins_D_W_M = input("30")
    Range2 = input(1)
    
    SELL = security(tickerid, LRG_Channel_TF_mins_D_W_M, highest(Range2))
    BUY = security(tickerid, LRG_Channel_TF_mins_D_W_M, lowest(Range2))
    
    HI = plot(SELL, color=SELL!=SELL[1]?na:red,linewidth=2 )
    LO = plot(BUY, color=BUY!=BUY[1]?na:green,linewidth=2 )
    fill(HI, LO, color=#E3CAF1, transp=100)
    Hcon = high >= SELL
    Lcon = low <= BUY
    
    plotshape(Hcon, style=shape.triangledown, color=maroon, location=location.abovebar)
    plotshape(Lcon, style=shape.triangleup, color=green, location=location.belowbar)
    range2 = SELL-BUY
    //--------------------------------------------------
    
    SML_Channel_TF_mins_D_W_M = input('240')
    M_HIGH = security(tickerid, SML_Channel_TF_mins_D_W_M, high)
    M_LOW = security(tickerid, SML_Channel_TF_mins_D_W_M, low)
    plot(M_HIGH, color=M_HIGH != M_HIGH[1] ?na:fuchsia, style=line, linewidth=2)
    plot(M_LOW, color=M_LOW != M_LOW[1] ?na:fuchsia, style=line, linewidth=2)
    //--------------------------------------------------
    Zingzag_length = input(7)
    hls = rma(hl2, Zingzag_length)
    isRising = hls >= hls[1]
    
    zigzag1 = isRising and not isRising[1] ? lowest(Zingzag_length) :  not isRising and isRising[1] ? highest(Zingzag_length) : na
    plot(zigzag1, color=black)
    
    Zigzag2 = input(false)
    zigzag = Hcon ? high : Lcon ? low : na
    plot(not Zigzag2 ? na : zigzag, color=red, style=line, linewidth=3)
    
    //=====================================================================//


    Thanks in advance

    VDUB-binary-pro-3-v2.png VDUB-binary-pro-3-v2.png
    #93922 quote
    NicolasNicolas
    Keymaster
    Legend

    Please respect rules for code conversion query: Ask for a free code conversion

    I will complete your post for you..

    This code is not an automated trading system, it is an indicator, you post at the wrong place too..

    #93924 quote
    NicolasNicolas
    Keymaster
    Legend

    This trading system has 4 or 5 indicators, which one do you want to be converted? The 2 oscillators below the chart are using other timeframes data, which is not possible to do with ProBuilder.

    #93928 quote
    kryomancer86kryomancer86
    Participant
    Veteran

    Thanks Nicolas for helping me with the process.

    Do we have these indicators in PRT already? or they are some custom indicators?

Viewing 4 posts - 1 through 4 (of 4 total)

  • You must be logged in to reply to this topic.

ProRealAI ProRealAI New

Stuck on this ProBuilder code?

Describe what this topic is trying to build, in plain English, and ProRealAI writes the ProRealTime™ indicator, screener or system for you.

Available in 7 languages
Try ProRealAI

VDUB_Binary Startegy from TradingView


ProBuilder: Indicators & Custom Tools

New Reply
Author
Summary

This topic contains 3 replies,
has 2 voices, and was last updated by kryomancer86kryomancer86
7 years, 6 months ago.

Topic Details
Forum: ProBuilder: Indicators & Custom Tools
Language: English
Started: 03/18/2019
Status: Active
Attachments: 1 files
ProRealCode ProRealCode
Loading...