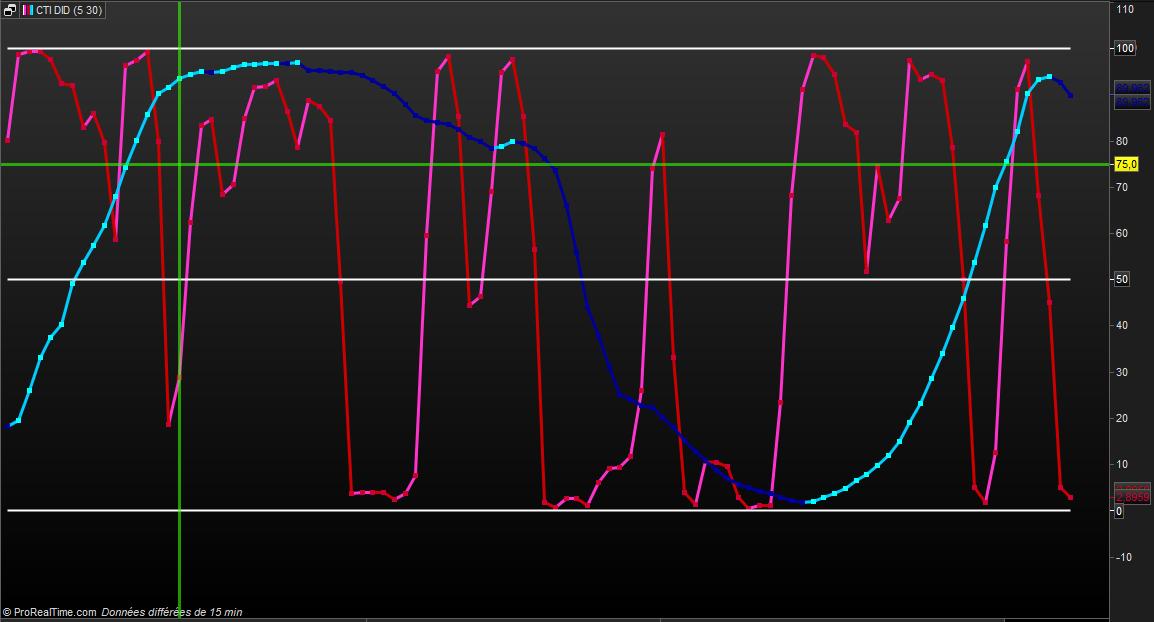
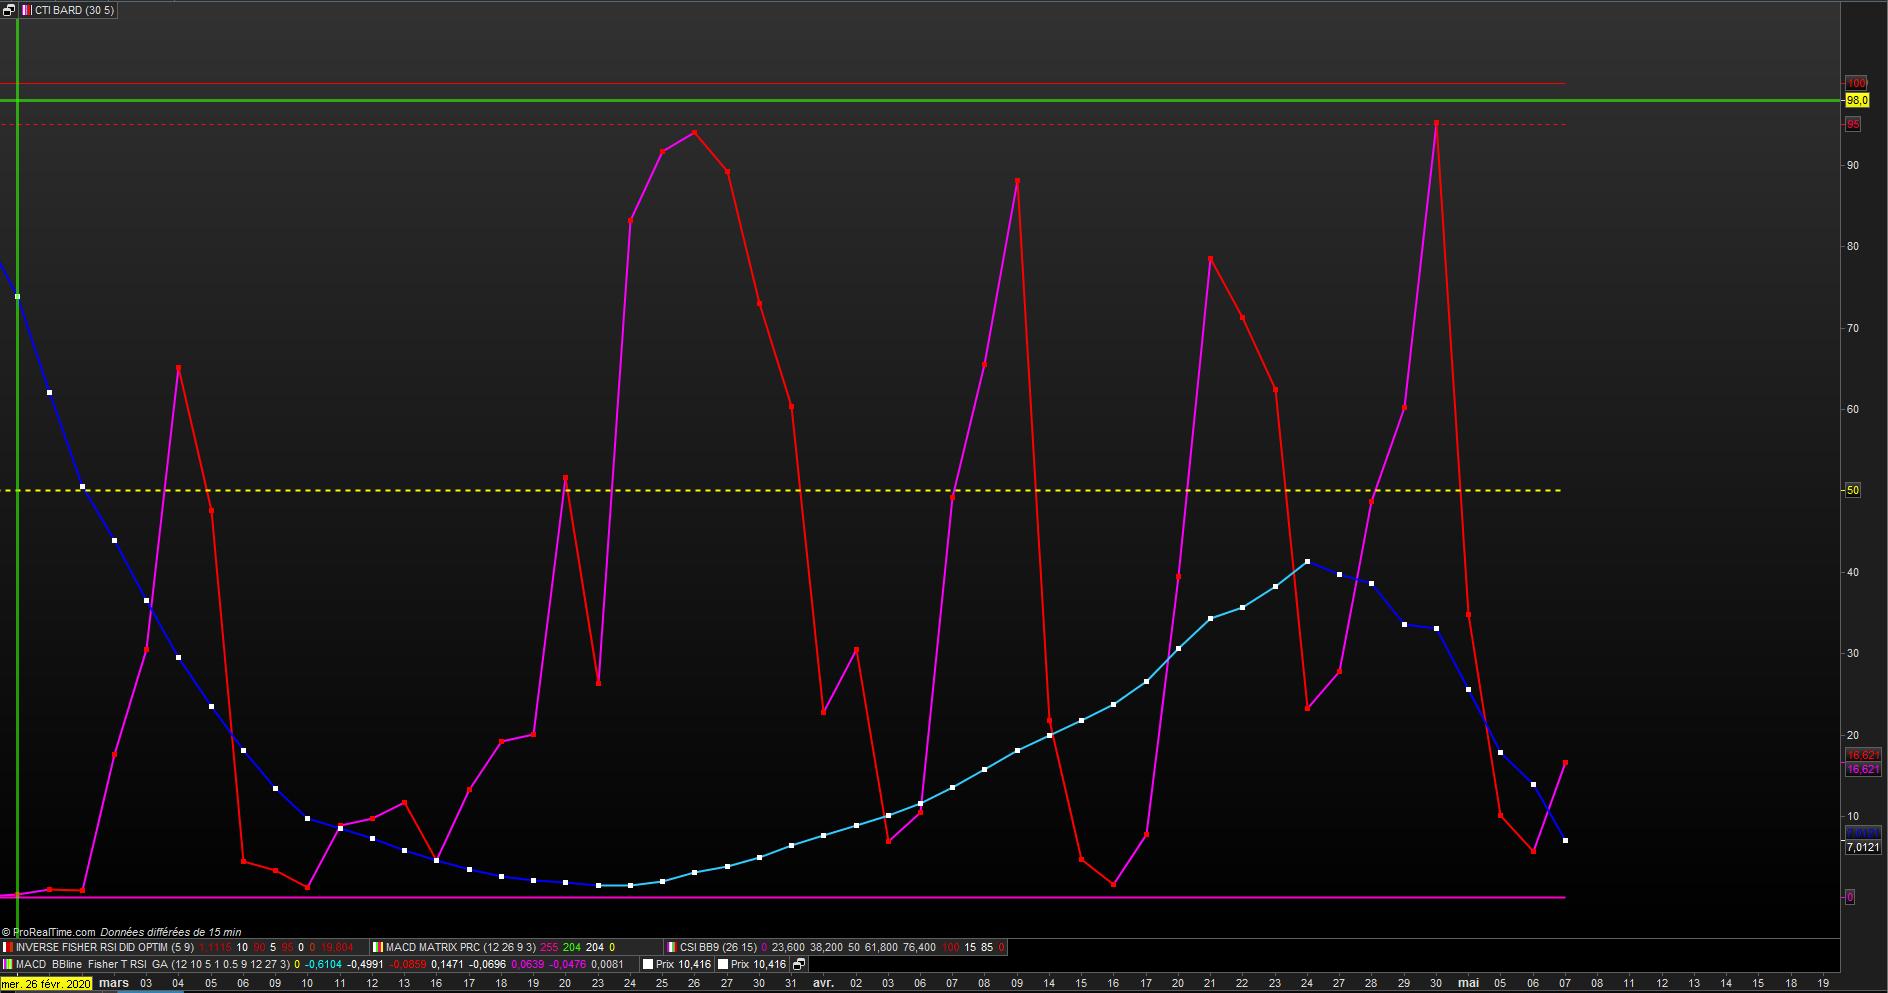
If the returned value is only ever between -1 and 1 then simply add 1 then divide by 2 then multiply by 100.
Hola Vonasi
Where can i place this parameters into the code ? I don’t know where
thanks you
Just add the following above the return line.
ctiL = ((ctil+1)/2)*100
ctiS = ((ctil+1)/2)*100
Gracias Vonasi , viva la Pepa !!!
code and graph attached
supertiti – It is better if you post an ITF file of the code that you have exported from the platform and a PNG file of the image rather than a DOCX for people to have to download.
Hi Bard, you have posted in the library but without the itf file. If I understand well, you want the code from the above post:
https://www.prorealcode.com/topic/very-latest-ehlers-correlation-trend-indicator-2/#post-129559 to be featured in the library, right? Thanks.
For French traders Open office is free
https://www.openoffice.org/fr/
// CTI NICO d'après BARD adapté par VONASI 03.05.2020

//Ehler's Correlation Trend Indicator (CTI) //PRC_R-Squared coefficient | indicator
//19.09.2018 //Nicolas @ www.prorealcode.com / Bard //Sharing ProRealTime knowledge

// --- settings
//SPeriod length   = 10   perso = 5//Add in Variables
//LPeriod lengthL  = 40   perso = 30 //Add in Variables
// --- end of settings

defparam calculateonlastbars = 100
// SHORT

Sx = 0
Sy = 0
Sxx = 0
Sxy = 0
Syy = 0

data=customclose

for count = 0 to Length -1 do
X = Data[count] // the price curve
Y = -count // the trend line
Sx = Sx + X
Sy = Sy + Y
Sxx = Sxx + X*X
Sxy = Sxy + X*Y
Syy = Syy + Y*Y
next
if(Length*Sxx-Sx*Sx > 0 and Length*Syy-Sy*Sy > 0) then
ctiS= (Length*Sxy-Sx*Sy)/sqrt((Length*Sxx-Sx*Sx)*(Length*Syy-Sy*Sy))
endif
//////////////////////////////////////////////////////////////

// LONG
Sx = 0
Sy = 0
Sxx = 0
Sxy = 0
Syy = 0

data=customclose

for count = 0 to LengthL -1 do
X = Data[count] // the price curve
Y = -count // the trend line
Sx = Sx + X
Sy = Sy + Y
Sxx = Sxx + X*X
Sxy = Sxy + X*Y
Syy = Syy + Y*Y
next
if(LengthL*Sxx-Sx*Sx > 0 and LengthL*Syy-Sy*Sy > 0) then
ctiL= (LengthL*Sxy-Sx*Sy)/sqrt((LengthL*Sxx-Sx*Sx)*(LengthL*Syy-Sy*Sy))
endif
//////////////////////////////////////////////////////////////

//ctiS =((ctiS+1)/2)*100
//ctiL =((ctiS+1)/2)*100

Return ((ctiS+1)/2)*100 style(line,3) as " ctiS ", ((ctiS+1)/2)*100 style (point,3) as " ctiS " ,((ctiL+1)/2)*100 style(line,3) as " ctiL ",((ctiL+1)/2)*100 style(point,3) as " ctiL " , 0 as " zero " , 50 as " 50 " , 100 as " 100 "
For French traders Open office is free
It is not about cost – it is about convenience for all forum members. ITF files can be saved and then directly imported into anyone’s PRT platform. PNG images when attached can be viewed with just one click. Code inserted into a post can be cut and pasted quickly and easily.
 Bard
BardParticipant
Master
Hi
@Supertiti, the Long and Short values need to be different. I added “S” and “L” so it doesn’t read Sx= 0 but Sum”S”x = 0, etc so that it can plot two periods for the CTI.
BardParticipant
Master
Hi Nicolas, great, thanks, sorry yes I only posted the new CTI system and Dev Stop itf.
Yes please use the code in the link mentioned:
https://www.prorealcode.com/topic/very-latest-ehlers-correlation-trend-indicator-2/#post-129559
Thanks again for your help, always appreciated.
Looking good so far using Juanj’s Machine Learning code on the 5 and 10 period crosses and using ML on the CTI thresholds. About to turn the ML code on the period settings next…
Cheers!
BardParticipant
Master
Hi
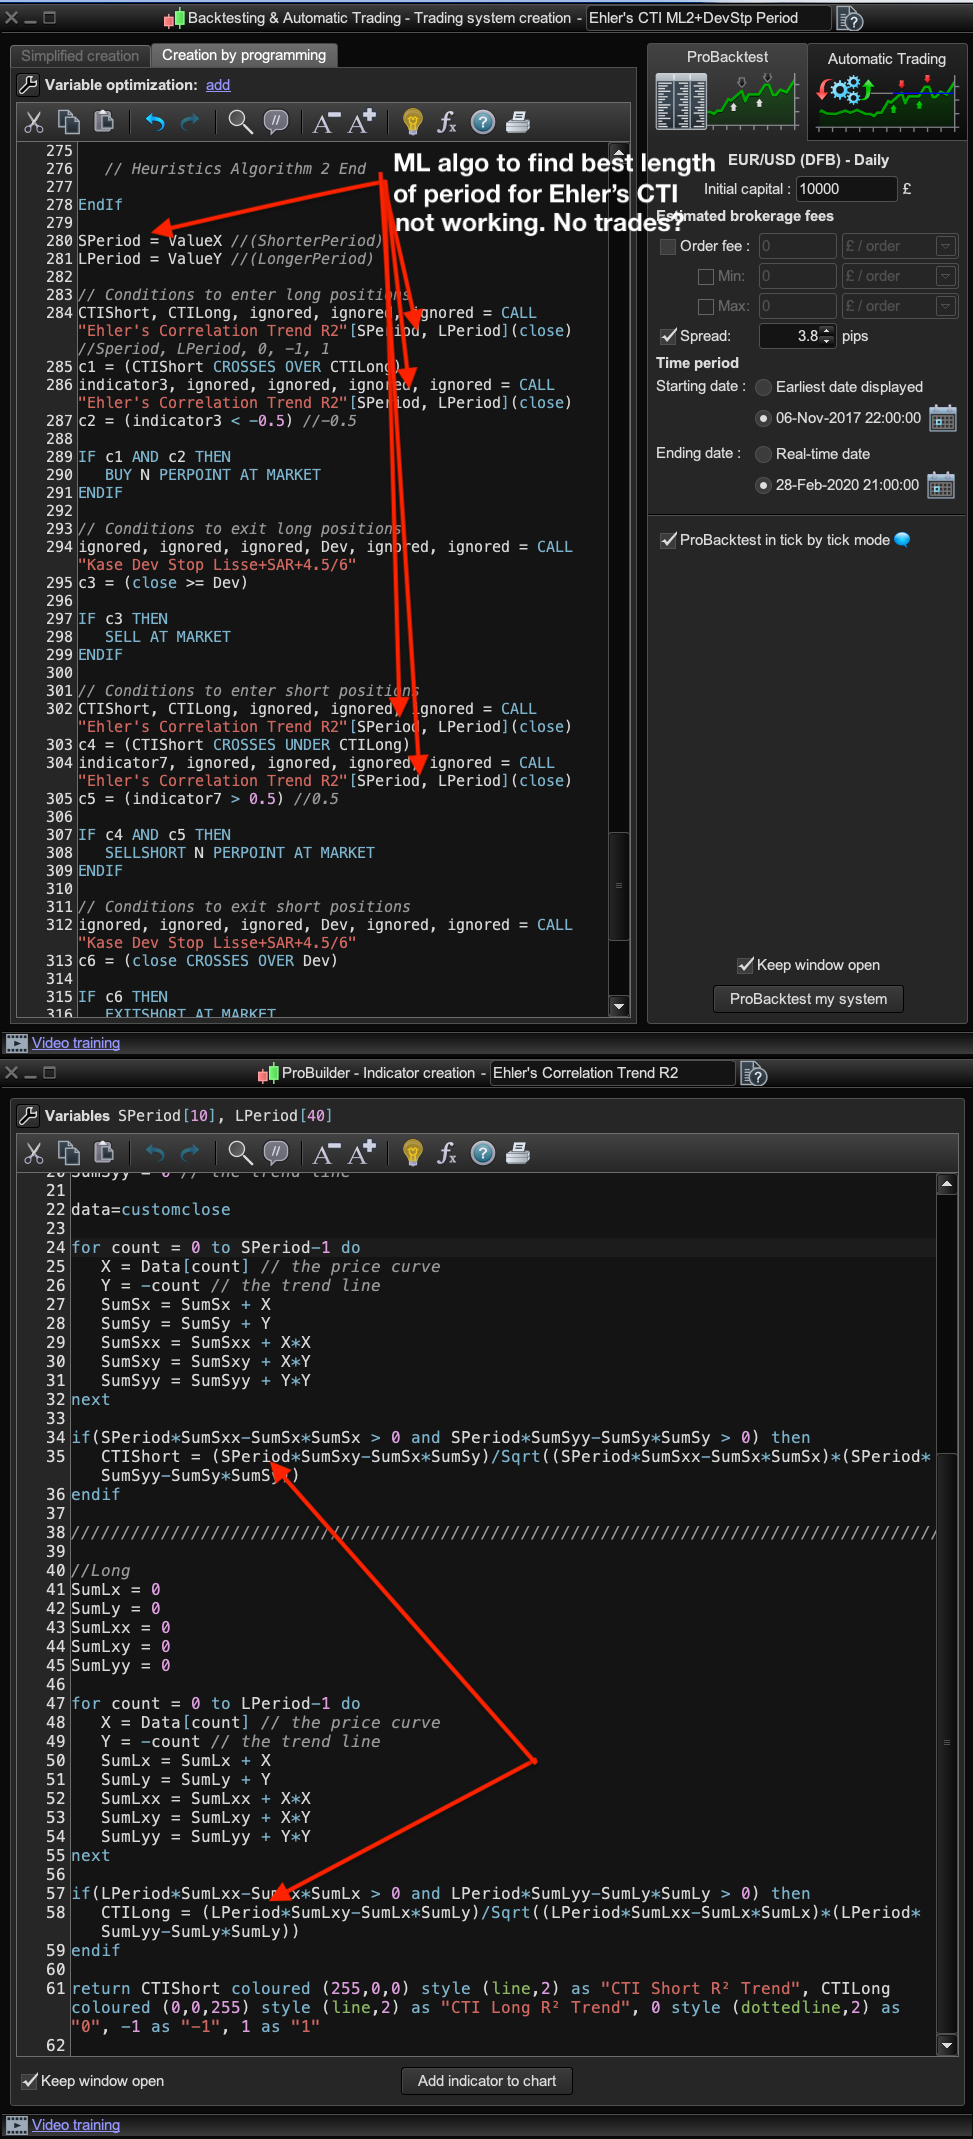
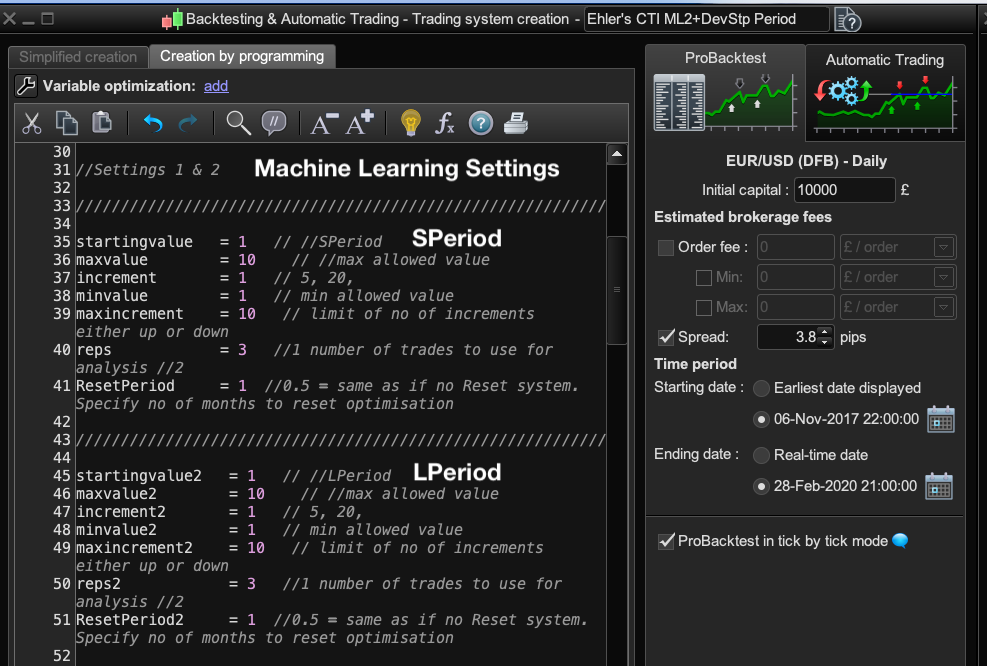
@Nicolas, well, after a few hours I can’t get the machine learning (ML) code to work out the best value for the Ehler’s CTI Speriod and Lperiod of this new indicator.
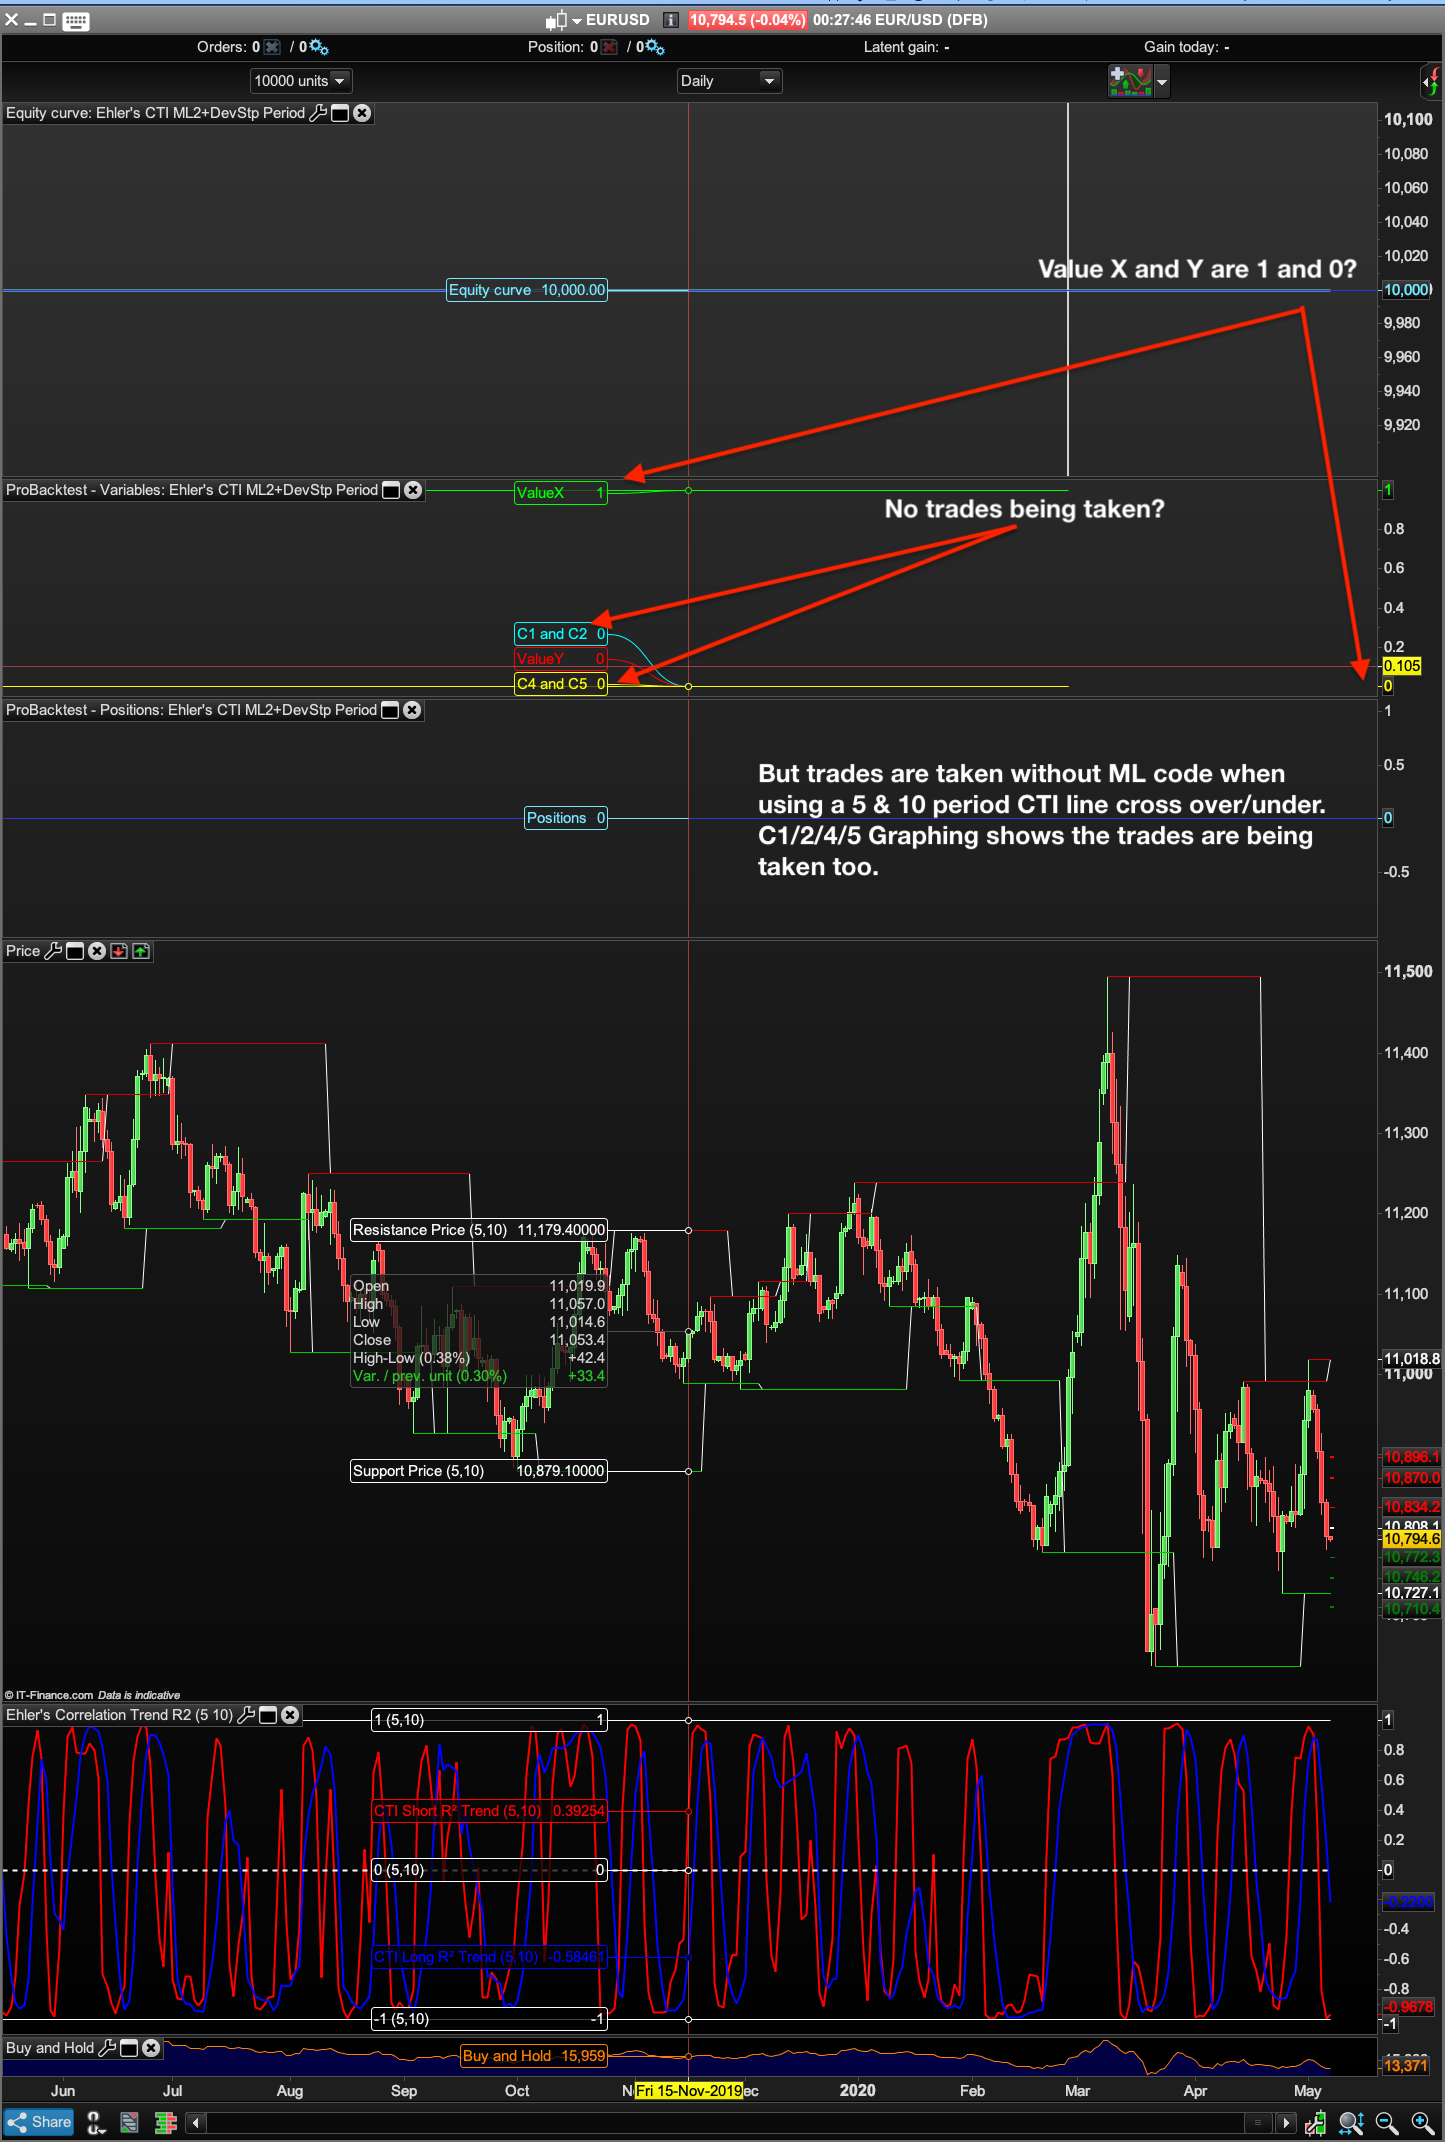
Typically when a ML system won’t work and the code is good (comparing an already working ML system with the non working one using a text-compare website) it’s the settings that the ML code works through — from Starting value to Max value etc — that aren’t working, but I already know a cross over of the 5 period and 10 period CTI are good for long positions and vice versa for shorts. I just want to find out if a 3 and 7 for example are better – I will see this from graphing Value X and Y.
I can get the ML to work on a Ehler’s CTI system that looks for the best ML chosen thresholds of the CTI (graphing of X and Y thresholds in increments of 0.1 plots okay on the variables chart with static CTI periods of 5 and 10, — which work well).
Can you see from the screenshots below what is missing? The ML settings simply ask the ML algo to choose between CTI periods of 1 to 10 days for both the SPeriod short red CTI line and the LPeriod blue CTI line.
Btw, I did re-read the lengthy post:
https://www.prorealcode.com/topic/how-do-you-optimise-atr-stops-around-price
again just to be sure I have done everything right in terms of labelling even though this is not a PRT optimisation but a ML algo coded “optimisation.” I hope this isn’t going to bring you out in a cold sweat!? 😅 Cheers!
Did you GRAPH the CALLed variables in a backtest to see if the indicator is computing correctly? First step for debugging!
Good morning all,
scale from 0 to 100
I would like to do a screener where:
C1 = CTI short [1] < 30
C2 = CTI short crosses over CTI long
Short term strategy: when you have the result sell above 95
thank you
// CTI BARD
//Ehler's Correlation Trend Indicator (CTI) //PRC_R-Squared coefficient | indicator
//19.09.2018 //Updated to double Ehler's R2 03/05/2020
//Nicolas @ www.prorealcode.com //Sharing ProRealTime knowledge

// --- settings
//LPeriod     =40 //Add in Variables  perso = 30
//SPeriod     =10 //Add in Variables  perso = 5
// --- end of settings

///////////////////////////////////////////////////////////////////////////////////////////////////
Defparam calculateonlastbars = 100
//Short
SumSx = 0 // the price curve
SumSy = 0
SumSxx = 0
SumSxy = 0
SumSyy = 0 // the trend line

data=customclose

for count = 0 to SPeriod-1 do
X = Data[count] // the price curve
Y = -count // the trend line
SumSx = SumSx + X
SumSy = SumSy + Y
SumSxx = SumSxx + X*X
SumSxy = SumSxy + X*Y
SumSyy = SumSyy + Y*Y
next

if(SPeriod*SumSxx-SumSx*SumSx > 0 and SPeriod*SumSyy-SumSy*SumSy > 0) then
CTIShort = (SPeriod*SumSxy-SumSx*SumSy)/Sqrt((SPeriod*SumSxx-SumSx*SumSx)*(SPeriod*SumSyy-SumSy*SumSy))
endif

///////////////////////////////////////////////////////////////////////////////////////////////////

//Long
SumLx = 0
SumLy = 0
SumLxx = 0
SumLxy = 0
SumLyy = 0

for count = 0 to LPeriod-1 do
X = Data[count] // the price curve
Y = -count // the trend line
SumLx = SumLx + X
SumLy = SumLy + Y
SumLxx = SumLxx + X*X
SumLxy = SumLxy + X*Y
SumLyy = SumLyy + Y*Y
next

if(LPeriod*SumLxx-SumLx*SumLx > 0 and LPeriod*SumLyy-SumLy*SumLy > 0) then
CTILong = (LPeriod*SumLxy-SumLx*SumLy)/Sqrt((LPeriod*SumLxx-SumLx*SumLx)*(LPeriod*SumLyy-SumLy*SumLy))
endif
//return CTIShort  style (line,2) as "CTI Short R² Trend" , CTIShort style (point,3) as "CTI Short R² Trend"  , CTILong  style (line,2) as "CTI Long R² Trend", CTILong  style (point,3) as "CTI Long R² Trend" , 0 style (dottedline,2)as "0", -1 as "-1", 1 as "1"
// ((ctiShort+1)/2)*100

return (( CTIShort +1)/2)*100  style (line,2) as "CTI Short R² Trend" , (( CTIShort +1)/2)*100 style (point,3) as "CTI Short R² Trend"  ,(( CTILong +1)/2)*100  style (line,2) as "CTI Long R² Trend", (( CTILong +1)/2)*100 style (point,3) as "CTI Long R² Trend" , 50 style (dottedline,2)as " 50 ", 0 as " 0 ", 100 as " 100 ", 95 as " 95 "
BardParticipant
Master
Yes, I think so!? Screenshot 2!?
I also tried, as is the normal way to use ML code in a system, with my ValueX and ValueY in the Call line “indicator name” [5, 10] as in: “indicator name” [ValueX and ValueY].
Neither that way or using “indicator name”[SPeriod, L Period] works?
Good evening,
I think this screener code is the right one after several tries.
Each will modify the parameters to their liking.
// CTI BARD UP screener
//Ehler's Correlation Trend Indicator (CTI) //PRC_R-Squared coefficient | indicator
//19.09.2018 //Updated to double Ehler's R2 03/05/2020
//Nicolas @ www.prorealcode.com //Sharing ProRealTime knowledge

// --- settings
//LPeriod     =40 //Add in Variables  perso = 30
//SPeriod     =10 //Add in Variables  perso = 5
// --- end of settings
///////////////////////////////////////////////////////////////////////////////////////////////////
LPeriod     = 30 //Add in Variables  perso = 30
SPeriod     = 5  //Add in Variables  perso = 5
//Short
SumSx = 0 // the price curve
SumSy = 0
SumSxx = 0
SumSxy = 0
SumSyy = 0 // the trend line

data=customclose

for count = 0 to SPeriod-1 do
X = Data[count] // the price curve
Y = -count // the trend line
SumSx = SumSx + X
SumSy = SumSy + Y
SumSxx = SumSxx + X*X
SumSxy = SumSxy + X*Y
SumSyy = SumSyy + Y*Y
next

if(SPeriod*SumSxx-SumSx*SumSx > 0 and SPeriod*SumSyy-SumSy*SumSy > 0) then
CTIShort = (SPeriod*SumSxy-SumSx*SumSy)/Sqrt((SPeriod*SumSxx-SumSx*SumSx)*(SPeriod*SumSyy-SumSy*SumSy))
endif
///////////////////////////////////////////////////////////////////////////////////////////////////
//Long
SumLx = 0
SumLy = 0
SumLxx = 0
SumLxy = 0
SumLyy = 0

for count = 0 to LPeriod-1 do
X = Data[count] // the price curve
Y = -count // the trend line
SumLx = SumLx + X
SumLy = SumLy + Y
SumLxx = SumLxx + X*X
SumLxy = SumLxy + X*Y
SumLyy = SumLyy + Y*Y
next

if(LPeriod*SumLxx-SumLx*SumLx > 0 and LPeriod*SumLyy-SumLy*SumLy > 0) then
CTILong = (LPeriod*SumLxy-SumLx*SumLy)/Sqrt((LPeriod*SumLxx-SumLx*SumLx)*(LPeriod*SumLyy-SumLy*SumLy))
endif

// return (( CTIShort +1)/2)*100  style (line,2) as "CTI Short R² Trend" , (( CTIShort +1)/2)*100 style (point,3) as "CTI Short R² Trend"  ,(( CTILong +1)/2)*100  style (line,2) as "CTI Long R² Trend", (( CTILong +1)/2)*100 style (point,3) as "CTI Long R² Trend" , 50 style (dottedline,2)as " 50 ", 0 as " 0 ", 100 as " 100 " , 95 as " 95 "

c1 = ((ctishort[1]+1)/2)*100[1] < 15
c2 = ctishort crosses over ctilong
c3 = ((ctiLong+1)/2)*100 < 20

SCREENER [c1 and c2 and c3 ]