Expert Services

No recent search

VPA Indicator & Volume Spread Analysis
- Forums
- ProRealTime English Forum
- ProBuilder: Indicators & Custom Tools
- VPA Indicator & Volume Spread Analysis
-
AuthorPosts
-
Hello, I am new to ProrReal Time and assessing the functionalities.
Is anybody familiar with the VPA indicator? I have been using on US market for ever and it is very powerful. I am not sure how complex it would to code it in ProRealTime?
code from trading View here:
VPA ANALYSIS by karthikmarar — Pine Script™ Editor
Experiments in Technical Analysis
I would love to meet coder and specialist of PRT as I am trying to get advice on what isdoable – my us database do not do European stocks so am trying to replicate lots of technical (and fundamental screening) indicators for EU markets
best regards
Frederic Batoua
[Email address removed by moderators, please see yellow box at bottom of page just before the “submit” message button, highlighting main forum rules, thanks]
code from trading View here:
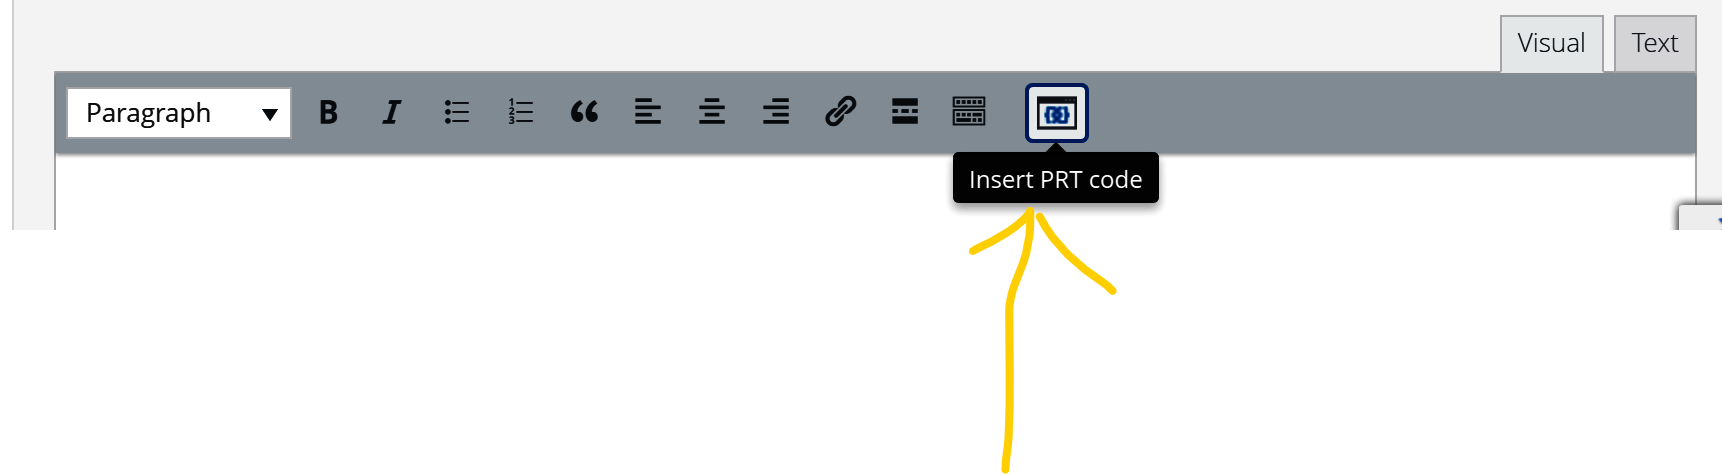
You will get a better response if you post / show the code on here, ideally using the blue ‘Insert PRT Code’ button at the far right of the toolbar (but often the ‘blue button’ does not show … try refreshing your screen a few times and / or clear your cache for this website).
Attached (at yellow arrowhead) shows the button you need to post the code.
tudy(“VPA ANALYSIS “, overlay=true)trind = input(title=”Trend Indication”, type=input.bool, defval=false)bkbg = input(title=”Black Background”, type=input.bool, defval=false)plot50 = input(title=”Plot 50 MA”, type=input.bool, defval=false)plot200 = input(title=”Plot 200 MA”, type=input.bool, defval=false)plot(plot50? sma(close,50): na, color= color.blue, style = plot.style_line )plot(plot200? sma(close,200): na, color= color.red, style = plot.style_line )//===================== Basic Definitions =======================================volAvg = sma(volume,40)volMean = stdev(volAvg,30)volUpBand3 = volAvg + (3*volMean)volUpBand2 = volAvg + (2*volMean)volUpBand1 = volAvg + (1*volMean)volDnBand1 = volAvg -(1*volMean)volDnBand2 = volAvg – (2*volMean)H = highL = lowV = volumeC = closemidprice = (H+L)/2spread = (H-L)avgSpread = sma(spread,40)AvgSpreadBar = spread > avgSpread// to be checkedwideRangeBar = spread>(1.5*avgSpread)narrowRangeBar = spread<(0.7*avgSpread)lowVolume = V<volume[1] and V<volume[2] and V <volAvg // modsupBar = C>close[1]//C>Ref(C,-1)downBar = C<close[1]//C<Ref(C,-1)highVolume = V>volume[1] and volume[1]>volume[2]// ReviewcloseFactor = C-LclsPosition = spread/closeFactorclosePosition = ((closeFactor == 0) ? (avgSpread) : (clsPosition))vb = V > volAvg or V> volume[1]upClose = C>=((spread*0.7)+L)// close is above 70% of the BardownClose = C<=((spread*0.3)+L)// close is below the 30% of the baraboveClose = C>((spread*0.5)+L)// close is between 50% and 70% of the barbelowClose = C<((spread*0.5)+L)// close is between 50% and 30% of the barmidClose = C>((spread*0.3)+L) and C<((spread*0.7)+L)// close is between 30% and 70% of the barveryLowClose = closePosition>4//close is below 25% of the barveryHighClose = closePosition<1.35// Close is above 80% of the barClosePos = iff(C<=((spread*0.2)+L),1,iff(C<=((spread*0.4)+L),2,iff(C<=((spread*0.6)+L),3,iff(C<=((spread*0.8)+L),4,5))))//1 = downClose, 2 = belowClose, 3 = midClose, 4 = aboveClose, 6 = upClosevolpos = iff(V>(volAvg*2),1,iff(V>(volAvg*1.3),2,iff(V>volAvg,3,iff(V<volAvg and (V<volAvg*0.7) ,4,5))))//1 = veryhigh, 2 = High , 3 = AboveAverage, 4 = volAvg //LessthanAverage, 5 = lowVolumefreshGndHi = high == highest(high,5)?1:0freshGndLo = low == lowest(low,5)?1:0//=========================================================================|// Trend Analysis Module |//=========================================================================|psmin = input(2,”Short term Min periods”, input.integer, minval=1, maxval=9, step=1)psmax = input(8,”Short term Max Periods”, input.integer, minval=1, maxval=9, step=1)rshmin = (high – nz(low[psmin])) / (atr(psmin) * sqrt(psmin))rshmax = (high – nz(low[psmax])) / (atr(psmax) * sqrt(psmax))RWIHi = max(rshmin,rshmax)rslmin = (nz(high[psmin]) – low) / (atr(psmin) * sqrt(psmin))rslmax = (nz(high[psmax]) – low) / (atr(psmax) * sqrt(psmax))RWILo = max(rslmin,rslmax)k = RWIHi-RWILoground = RWIHisky = RWILoplmin=input(10,”Long Term Min Periods”,type=input.integer,minval=1,maxval=32,step=1)plmax=input(40,”Long term Max Periods”,type=input.integer,minval=1,maxval=64,step=1)rlhmin = (high – nz(low[plmin])) / (atr(plmin) * sqrt(plmin))rlhmax = (high – nz(low[plmax])) / (atr(plmax) * sqrt(plmax))RWILHi = max(rlhmin,rlhmax)rllmin = (nz(high[plmin]) – low) / (atr(plmin) * sqrt(plmin))rllmax = (nz(high[plmax]) – low) / (atr(plmax) * sqrt(plmax))RWILLo = max(rllmin,rllmax)j = RWILHi-RWILLoj2 =RWILHik2 =RWILLoja = crossover(j,1) // The following section check the diffeent condition of the RWi above and below zerojb = crossover(1,j) // In oder to check which trend is doing whatjc = crossover(-1,j)jd = crossover(j,-1)j2a = crossover(j2,1)j2b = crossover(1,j2)k2a = crossover(k2,1)k2b = crossover(1,k2)//Define the Major, Minor and Immediate trend Statusupmajoron = j > 1 and ja[1]upmajoroff = j < 1 and jb[1]upminoron = j2 > 1 and j2a[1]upminoroff = j2 < 1 and j2b[1]dnmajoron = j < -1 and jc[1]dnmajoroff = j > -1 and jd[1]dnminoron = k2 > 1 and k2a[1]dnminoroff = k2 < 1 and k2b[1]upmid = iff(ground > 1, 1,0)dnimd = iff(sky > 1, 1, 0)upmajor = iff(j>1,1,iff(j<(-1),-1,0))upminor = iff(j2>1,1,-1)dnminor = iff(k2>1,1,-1)plotshape(upmajor ==1 and trind == true , text=””,style=shape.triangledown, color= color.lime, location=location.top,transp=0, size= size.small)plotshape(upmajor == -1 and trind == true , text=””,style=shape.triangledown, color=color.red, location=location.top,transp=0, size = size.small)plotshape(upmajor != -1 and upmajor != 1 and trind == true , text=””,style=shape.triangledown, color=color.yellow, location=location.top,transp=0, size = size.small)plotshape(upmid ==1 and trind == true , text=””,style=shape.circle, color= color.lime, location=location.top,transp=0,size = size.tiny)plotshape(upmid == -1 and trind == true , text=””,style=shape.circle, color= color.red, location=location.top,transp=0,size = size.tiny)plotshape(upmid != -1 and upmid !=1 and trind == true , text=””,style=shape.circle, color= color.yellow, location=location.top,transp=0,size = size.tiny)plotshape(upminor == 1 and trind == true , text=””,style=shape.square, color= color.lime, location=location.top,transp=0 )plotshape(upminor == -1 and trind == true , text=””,style=shape.square, color= color.red, location=location.top,transp=0)plotshape(upminor != 1 and upminor != -1 and trind == true , text=””,style=shape.square, color= color.yellow, location=location.top,transp=0)//=========================================================================|// Slope Calculation |//=========================================================================|src = sma(close,5)//————–longterm trend—————lts = linreg(src, 40, 0)ltsprev = linreg(close[3], 40, 0)ltsslope = ((lts – ltsprev) / 3 )//————-Medium Term Trend————-mts = linreg(src, 20, 0)mtsprev = linreg(close[3], 20, 0)mtsslope = ((mts – mtsprev) / 3 )//————-short Term Trend————-sts = linreg(src, 3, 0)stsprev = linreg(close[1], 3, 0)stsslope = ((sts – stsprev) / 2 )tls = stsslope//=========================================================================|// VSA SIGNAL GENERATION |//=========================================================================|upThrustBar = wideRangeBar and downClose and high > high[1] and upmid==1 //WRB and UHS in midterm trendnut = wideRangeBar and downClose and freshGndHi and highVolume // NEW SIGNAL – Upthrust after new short up movebc = wideRangeBar and aboveClose and volume == highest(volume,60) and upmajor==1 // Buying ClimaxupThrustBar1 = wideRangeBar and (ClosePos==1 or ClosePos==2) and upminor>0 and H>H[1]and (upmid>0 or upmajor>0) and volpos < 4 // after minor up trendupThrustBartrue = wideRangeBar and ClosePos==1 and upmajor>0 and H>H[1] and volpos < 4//occurs after a major uptrendupThrustCond1 = upThrustBar[1] and downBar and not narrowRangeBar // The Bar after Upthrust Bar- Confirms weaknessupThrustCond2 = upThrustBar[1] and downBar and V>(volAvg*1.3) // The Bar after Upthrust Bar- Confirms weaknessupThrustCond3 = upThrustBar and V>(volAvg*2) // ReviewtopRevBar = V[1]>volAvg and upBar[1] and wideRangeBar[1] and downBar and downClose and wideRangeBar and upmajor>0 and H==highest(H,10)// Top Reversal barPseudoUpThrust = (upBar[1])and H>H[1] and V[1]>1.5*volAvg and downBar and downClose and not upThrustBarpseudoUtCond = PseudoUpThrust[1] and downBar and downClose and not upThrustBartrendChange = upBar[1] and H==highest(H,5) and downBar and (downClose or midClose) and V>volAvg and upmajor>0 and upmid>0 and not wideRangeBar and not PseudoUpThrustnoDemandBarUt = upBar and narrowRangeBar and lowVolume and (aboveClose or upClose) and ((upminor>=0 and upmid>=0) or (upminor<=0 and upminor>=0))//in a up marketnoDemandBarDt = upBar and narrowRangeBar and lowVolume and (aboveClose or upClose) and (upminor<=0 or upmid<=0)// in a down or sidewayss marketnoSupplyBar = downBar and narrowRangeBar and lowVolume and midCloselowVolTest = low == lowest(low,5) and upClose and lowVolumelowVolTest1 = low == lowest(low,5) and V<volAvg and L<L[1] and upClose and upminor>0 and upmajor>0lowVolTest2 = lowVolTest[1] and upBar and upClosesellCond1 = (upThrustCond1 or upThrustCond2 or upThrustCond3)sellCond2 = sellCond1[1]==0sellCond = sellCond1 and sellCond2strengthDown0 = upmajor<0 and volpos < 4 and downBar[1] and upBar and ClosePos>3 and upminor <0 and upmid <=0strengthDown = volpos<4 and downBar[1] and upBar and ClosePos>3 and upmid<=00 and upminor<0 // Strength after a down trendstrengthDown1 = upmajor<0 and V>(volAvg*1.5) and downBar[1] and upBar and ClosePos>3 and upmid<=00 and upminor<0strengthDown2 = upmid<=0 and V[1]<volAvg and upBar and veryHighClose and volpos<4buyCond1 = strengthDown or strengthDown1buyCond = upBar and buyCond1[1]stopVolume = L==lowest(L,5) and (upClose or midClose) and V>1.5*volAvg and upmajor<0revUpThrust = upBar and upClose and V>V[1] and V>volAvg and wideRangeBar and downBar[1] and downClose[1] and upminor<0effortUp =H>H[1]andL>L[1]andC>C[1]andC>=((H-L)*0.7+L)andspread>avgSpreadandvolpos<4effortUpfail = effortUp[1] and (upThrustBar or upThrustCond1 or upThrustCond2 or upThrustCond3 or (downBar and AvgSpreadBar))effortDown =H<H[1]andL<L[1]andC<C[1]andC<=((H-L)*0.25+L)andwideRangeBarandV>V[1]effortDownFail = effortDown[1] and ((upBar and AvgSpreadBar) or revUpThrust or buyCond1)upflag = (sellCond or buyCond or effortUp or effortUpfail or stopVolume or effortDown or effortDownFail or revUpThrust or noDemandBarDt or noDemandBarUt or noSupplyBar or lowVolTest or lowVolTest1 or lowVolTest2 or bc)bullBar = (V>volAvg or V>V[1]) and C<=((spread*0.2)+L) and upBar and not upflagbearBar = vb and downClose and downBar and spread>avgSpread and not upflag//=============================== PLOT SHAPES SECTION============================//UPTHRUSTSplotshape((upThrustBarorupThrustBartrue)andnoteffortUpfailandnotsellCondandnotbc,”UT1″,style=shape.triangledown,location=location.abovebar,color=#990000,transp=0,text=”UT1″,textcolor=#990000,editable=false,size=size.tiny)UT1 = upThrustBar or upThrustBartrueplotshape((upThrustCond1orupThrustCond2ornut)andnoteffortUpfailandnotsellCondandnotbc,”UT2″,style=shape.triangledown,location=location.abovebar,color=#ff0000,transp=0,text=”UT2″,textcolor=#ff0000,editable=false,size=size.tiny)UT2 = upThrustCond1 or upThrustCond2UT = UT1 or UT2alertcondition(upThrustBar, title=’Alert on UT1 an UT2 and UT’, message=’An Upthrust Bar. A sign of weakness. High Volume adds weakness. A down bar after Upthrust adds weakness’)plotshape(topRevBarandnotsellCondandnotUTandnoteffortUpfail,”TRB”,style=shape.triangledown,location=location.abovebar,color=#ff9900,transp=0,text=”TRB”,textcolor=#ff9900,editable=false,size=size.tiny)alertcondition(topRevBar , title=’Alert on TRB’, message=’Top Reversal. Sign of Weakness. ‘)plotshape(trendChangeandnoteffortUpfail,”Tch”,style=shape.triangledown,location=location.abovebar,color=#ff471a,transp=0,text=”TC”,textcolor=#ff471a,editable=false,size=size.tiny)alertcondition(trendChange , title=’Alert on TCH’, message=’High volume Downbar after an upmove on high volume indicates weakness. ‘)plotshape(PseudoUpThrustandnoteffortUpfail,”PUT”,style=shape.triangledown,location=location.abovebar,color=#ff471a,transp=0,text=”PUT”,textcolor=#ff471a,editable=false,size=size.tiny)plotshape(pseudoUtCondandnoteffortUpfail,”PUC”,style=shape.triangledown,location=location.abovebar,color=#ff471a,transp=0,text=”PUC”,textcolor=#ff471a,editable=false,size=size.tiny)alertcondition(PseudoUpThrustorpseudoUtCond ,title=’Alert on PUT and PUC’,message=’Psuedo UpThrust. A Sign of Weakness.A Down Bar closing down after a Pseudo Upthrust confirms weakness. ‘)plotshape(noDemandBarUt,”ND”,style=shape.circle,location=location.abovebar,color=#ff471a,transp=0,text=”ND”,textcolor=#ff471a,editable=false,size=size.tiny)plotshape(noDemandBarDt,”ND”,style=shape.circle,location=location.abovebar,color=#e6e600,transp=0,text=”ND”,textcolor=#ff471a,editable=false,size=size.tiny)alertcondition(noDemandBarUtornoDemandBarDt ,title=’Alert on ND’,message=’No Demand in a Uptrend. A sign of Weakness. Otherwise upside unlikely soon ‘)plotshape(noSupplyBar,”NS”,style=shape.circle,location=location.belowbar,color=color.lime,transp=0,text=”NS”,textcolor=color.green,editable=false,size=size.tiny)alertcondition(noSupplyBar,title=’Alert on NS’,message=’No Supply. A sign of Strength. ‘)plotshape(lowVolTestandnoteffortDownFail,”LVT”,style=shape.circle,location=location.belowbar,color=color.lime,transp=0,text=”LVT”,textcolor=color.green,editable=false,size=size.tiny)plotshape(lowVolTest2andnoteffortUp,”ST”,style=shape.triangleup,location=location.belowbar,color=color.lime,transp=0,text=”ST”,textcolor=color.green,editable=false,size=size.tiny)lvt = lowVolTest or lowVolTest2alertcondition(lvt,title=’Alert on LVT’,message=’Test for supply.An upBar closing near High after a Test confirms strength. ‘)//————————————————-EFD = effortDownFailST1 = strengthDown0ST2 = strengthDown and not strengthDown2strcond = (strengthDown2 and not strengthDown0 and not strengthDown and not strengthDown1)? 1:0ST3 = strengthDown1ST4 = strengthDown2 and strcondST5 = strengthDown2 and not strcondST = ST1 or ST2 or ST3 or ST4 or ST5plotshape(strengthDown0andnotEFDandnoteffortUpandnotstopVolume,”ST1″,style=shape.triangleup,location=location.belowbar,color=color.lime,transp=0,text=”ST1″,textcolor=color.green,editable=false,size=size.tiny)plotshape(strengthDownandnotstrengthDown2andnotEFDandnoteffortUpandnotstopVolume,”ST2″,style=shape.triangleup,location=location.belowbar,color=color.lime,transp=0,text=”ST1″,textcolor=color.green,editable=false,size=size.tiny)plotshape(strengthDown1 and not EFD and not effortUp and not stopVolume, “ST3″, style=shape.triangleup, location=location.belowbar, color=color.lime, transp=0, text=”ST1”, textcolor=color.green, editable=false, size=size.auto)plotshape(strengthDown2andstrcondandnotEFDandnoteffortUpandnotstopVolume,”ST4″,style=shape.triangleup,location=location.belowbar,color=color.lime,transp=0,text=”ST2″,textcolor=color.green,editable=false,size=size.tiny)alertcondition(ST,title=’Alert on ST1, ST2, ST3, ST4 and ST’,message=’Strength seen returning after a down trend. ‘)//———————————————-//—————————————————plotshape(stopVolumeandnotST,”SV”,style=shape.circle,location=location.belowbar,color=color.lime,transp=0,text=”SV”,textcolor=color.green,editable=false,size=size.auto)plotshape(stopVolumeandST,”SV”,style=shape.circle,location=location.belowbar,color=color.lime,transp=0,text=”ST\nSV”,textcolor=color.green,editable=false,size=size.auto)alertcondition(stopVolume,title=’Alert on SV’,message=’Stopping volume. Normally indicates end of bearishness is nearing. ‘)plotshape(effortUpandnotSTandnotbuyCondandnoteffortDownFail,”EU”,style=shape.triangleup,location=location.belowbar,color=color.lime,transp=0,text=”EU”,textcolor=color.green,editable=false,size=size.tiny)alertcondition(effortUp,title=’Alert on EU’,message=’Effort to Move up. Bullish Sign ‘)plotshape(effortUpandSTandnotbuyCond,”EU”,style=shape.triangleup,location=location.belowbar,color=color.lime,transp=0,text=”ST\nEU”,textcolor=color.green,editable=false,size=size.tiny)plotshape(effortUpfailandnotUT,”EUF”,style=shape.triangledown,location=location.abovebar,color=color.red,transp=0,text=”EUF”,textcolor=color.red,editable=false,size=size.tiny)alertcondition(effortUpfail,title=’Alert on EUF’,message=’Effort to Move up Failed. Bearish sign ‘)plotshape(effortDownandnoteffortUpfail,”ED”,style=shape.triangledown,location=location.abovebar,color=color.red,transp=0,text=”ED”,textcolor=color.green,editable=false,size=size.tiny)alertcondition(effortDown,title=’Alert on ED’,message=’Effort to Move Down. Bearish Sign ‘)plotshape(effortDownFailandnotST,”EDF”,style=shape.triangleup,location=location.belowbar,color=color.lime,transp=0,text=”EDF”,textcolor=color.green,editable=false,size=size.tiny)alertcondition(effortDownFail,title=’Alert on EDF’,message=’Effort to Down Failed. Bullish sign ‘)plotshape(effortDownFailandST,”EDF”,style=shape.triangleup,location=location.belowbar,color=color.lime,transp=0,text=”ST\nEDF”,textcolor=color.green,editable=false,size=size.tiny)plotshape(revUpThrustandnotST,”RUT”,style=shape.triangleup,location=location.belowbar,color=color.lime,transp=0,text=”RUT”,textcolor=color.green,editable=false,size=size.auto)alertcondition(revUpThrust,title=’Alert on RUT’,message=’Reverse Up Thrust – Bullish ‘)plotshape(buyCondandnotSTandnoteffortUpandnotlvt,”BYC1″,style=shape.triangleup,location=location.belowbar,color=color.lime,transp=0,text=”BYC”,textcolor=color.green,editable=false,size=size.tiny)alertcondition(buyCond,title=’Alert on BYC’,message=’Strength Returns – Buy Condition exist ‘)plotshape(buyCond and not ST and effortUp, “BYC2″, style=shape.triangleup, location=location.belowbar, color=color.lime, transp=0, text=”EU\nBYC”, textcolor=color.green, editable=false, size=size.tiny)plotshape(sellCondandnotUT,”SEC”,style=shape.triangledown,location=location.abovebar,color=color.red,transp=0,text=”SEC”,textcolor=color.red,editable=false,size=size.tiny)alertcondition(sellCond ,title=’Alert on SEC’,message=’Weakness Returns – Sell Condition exist ‘)plotshape(sellCondandUT,”SEC”,style=shape.triangledown,location=location.abovebar,color=color.red,transp=0,text=”UT\nSEC”,textcolor=color.red,editable=false,size=size.tiny)plotshape(bcandnotUT,”BC”,style=shape.triangledown,location=location.abovebar,color=color.red,transp=0,text=”BC”,textcolor=color.red,editable=false,size=size.tiny)alertcondition(bc ,title=’Alert on BC’,message=’Buying Climax – End of Current Up Trend ‘)plotshape(bcandUT,”BC”,style=shape.triangledown,location=location.abovebar,color=color.red,transp=0,text=”UT\nBC”,textcolor=color.red,editable=false,size=size.tiny)//—————————–Bar coloring Code————————————————-//Vlp=Param(“Volume lookback period”,150,20,300,10);Vrg=sma(volume,30)// average volumerg=(high-close)arg=wma(rg,30)Vh=volume>volume[1] and volume[1]>volume[2]Cloc=close-lowx=(high-low)/Clocx1=Cloc==0?arg:xVb1 = volume >Vrg or volume > volume[1]ucls=x1<2dcls=x1>2mcls=x1<2.2andx1>1.8Vlcls=x1>4Vhcls=x1<1.35upbar = close > close[1]dnbar = close < close[1]CloseUp = close > close[1]CloseDn = close < close[1]VolUp = volume > volume[1]VolDn = volume < volume[1]bb1 = upbar and CloseUp and ucls and low > low[1]bb2 = upbar and VolUpbb3 = dnbar and CloseDn and VolDnbb4 = dnbar and CloseDn and close > close[1]db1 = dnbar and CloseDn and dclsdb2 = dnbar and VolUpdb3 = upbar and CloseDn and VolUpdb4 = upbar and CloseDn and close<low[1] and dclsdb5 = upbar and CloseUp and ucls and low<low[1]db6 = upbar and CloseUp and dclsbb=(bb1 or bb2 or bb3 or bb4)db=(db1 or db2 or db3 or db4 or db5 or db6)//neucolor = bkbg == true ? color.white : color.bluemcolor=bbandtls>0?color.green:(dbandtls<0?color.red:(bkbg==true?color.white:color.blue))bgcolor(bkbg==true?color.black:color.white,transp=0, editable=false)barcolor(color=mcolor)Do not double post. Ask your question only once and only in one forum. All double posts will be deleted anyway so posting the same question multiple times will just be wasting your own time and will not get you an answer any quicker. Double posting just creates confusion in the forums
Use the correct forum. Since this is an indicator, the ProBuilder forium should be used.
I move it. I also deleted the other topic in the French forum.
Thanks 🙂
many thanks – sorry for inconvenience
Here it is:
//------------------------------------------------------// //PRC VPA ANALYSIS //version = 0 //30.01.25 //Iván González @ www.prorealcode.com //Sharing ProRealTime knowledge //------------------------------------------------------// // inputs //------------------------------------------------------// trind=0 // trend indication bkbg=0 // black background plot50=1 // Plot sma50 plot200=1 // Plot sma200 psmin=2 // Short term Min periods psmax=8 // Short term Max periods plmin=10 // Long term Min periods plmax=40 // Long term Max periods //------------------------------------------------------// // basic definitions //------------------------------------------------------// // Simple Moving averages if plot50 then sma50=average[50](close) else sma50=undefined endif if plot200 then sma200=average[200](close) else sma200=undefined endif // Volume volavg=average[40](volume) volmean=std[30](volavg) volUpband3=volavg+3*volmean volUpband2=volavg+2*volmean volUpband1=volavg+1*volmean volDnband1=volavg-1*volmean volDnband2=volavg-2*volmean lowVolume=volume<volume[1] and volume<volume[2] and volume<volavg highVolume=volume>volume[1] and volume[1]>volume[2] vb=volume>volavg and volume>volume[1] // Prices midprice=(high+low)/2 spread=high-low avgSpread=average[40](spread) avgSpreadBar=spread>avgspread wideRangeBar=spread>1.5*avgspread narrowRangeBar=spread<0.7*avgspread upBar=close>close[1] downBar=close<close[1] closeFactor=close-low clsPosition=spread/closeFactor if closeFactor=0 then closePosition=avgSpread else closePosition=clsPosition endif upClose=close>=(spread*0.7+low) downClose=close<=(spread*0.3+low) aboveClose=close>(spread*0.5+low) belowClose=close<(spread*0.5+low) midClose=close>(spread*0.3+low) and close<(spread*0.7+low) veryLowClose=closePosition>4 veryHighClose=closePosition<1.35 if close<=spread*0.2+low then ClosePos=1 elsif close<=spread*0.4+low then ClosePos=2 elsif close<=spread*0.6+low then ClosePos=3 elsif close<=spread*0.8+low then ClosePos=4 else ClosePos=5 endif if volume>volavg*2 then volPos=1 elsif volume>volavg*1.3 then volPos=2 elsif volume>volavg*1 then volPos=3 elsif volume>volavg*0.7 then volPos=4 else volPos=5 endif if high=highest[5](high) then freshGndHi=1 else freshGndHi=0 endif if low=lowest[5](low) then freshGndLo=1 else freshGndLo=0 endif //------------------------------------------------------// // Trend Analysis Module //------------------------------------------------------// // Short Term rshmin=(high-low[psmin])/(averagetruerange[psmin](close)*sqrt(psmin)) rshmax=(high-low[psmax])/(averagetruerange[psmax](close)*sqrt(psmax)) RWIHi=max(rshmin,rshmax) rslmin=(high[psmin]-low)/(averagetruerange[psmin](close)*sqrt(psmin)) rslmax=(high[psmax]-low)/(averagetruerange[psmax](close)*sqrt(psmax)) RWILo=max(rslmin,rslmax) k=RWIHi-RWILo ground=RWIHi sky=RWILo // Long Term rlhmin=(high-low[plmin])/(averagetruerange[plmin](close)*sqrt(plmin)) rlhmax=(high-low[plmax])/(averagetruerange[plmax](close)*sqrt(plmax)) RWILHi=max(rlhmin,rlhmax) rllmin=(high[plmin]-low)/(averagetruerange[plmin](close)*sqrt(plmin)) rllmax=(high[plmax]-low)/(averagetruerange[plmax](close)*sqrt(plmax)) RWILLo=max(rllmin,rllmax) j=RWILHi-RWILLo j2=RWILHi k2=RWILLo ja=j crosses over 1 jb=j crosses under 1 jc=j crosses under -1 jd=j crosses over -1 j2a=j2 crosses over 1 j2b=j2 crosses under 1 k2a=k2 crosses over 1 k2b=k2 crosses under 1 upmajoron = j > 1 and ja[1] upmajoroff = j < 1 and jb[1] upminoron = j2 > 1 and j2a[1] upminoroff = j2 < 1 and j2b[1] dnmajoron = j < -1 and jc[1] dnmajoroff = j > -1 and jd[1] dnminoron = k2 > 1 and k2a[1] dnminoroff = k2 < 1 and k2b[1] if ground>1 then upmid=1 drawtext("●",barindex,high+tr*0.35)coloured("lime",255*trind) else upmid=0 drawtext("●",barindex,high+tr*0.35)coloured("yellow",255*trind) endif if sky>1 then dnimd=1 else dnimd=0 endif if j>1 then upmajor=1 drawtext("▼",barindex,high+tr*0.35)coloured("lime",255*trind) elsif j<-1 then upmajor=-1 drawtext("▼",barindex,high+tr*0.35)coloured("red",255*trind) else upmajor=0 drawtext("▼",barindex,high+tr*0.35)coloured("yellow",255*trind) endif if j2>1 then upminor=1 drawtext("◼︎",barindex,high+tr*0.35)coloured("lime",255*trind) else upminor=-1 drawtext("◼︎",barindex,high+tr*0.35)coloured("red",255*trind) endif if k2>1 then dnminor=1 else dnminor=-1 endif //------------------------------------------------------// // Slope Calculation //------------------------------------------------------// src=average[5](close) // Long term trend lts=LinearRegression[40](src) ltsprev=LinearRegression[40](close[3]) ltsslope=(lts-ltsprev)/3 // Medium term trend mts=LinearRegression[20](src) mtsprev=LinearRegression[20](close[3]) mtsslope=(mts-mtsprev)/3 // Short term trend sts=LinearRegression[3](src) stsprev=LinearRegression[3](close[1]) stsslope=(sts-stsprev)/2 tls=stsslope //------------------------------------------------------// // VSA signal generation //------------------------------------------------------// //WRB and UHS in midterm trend upThrustBar=wideRangeBar and downClose and high > high[1] and upmid=1 // NEW SIGNAL - Upthrust after new short up move nut=wideRangeBar and downClose and freshGndHi and highVolume // Buying Climax bc=wideRangeBar and aboveClose and volume = highest[60](volume) and upmajor=1 // after minor up trend upThrustBar1 = wideRangeBar and (ClosePos=1 or ClosePos=2) and upminor>0 and High>High[1] and (upmid>0 or upmajor>0) and volpos < 4 // occurs after a major uptrend upThrustBartrue = wideRangeBar and ClosePos=1 and upmajor>0 and High>High[1] and volpos < 4 // The Bar after Upthrust Bar- Confirms weakness upThrustCond1 = upThrustBar[1] and downBar and not narrowRangeBar // The Bar after Upthrust Bar- Confirms weakness upThrustCond2 = upThrustBar[1] and downBar and Volume>(volAvg*1.3) // Review upThrustCond3 = upThrustBar and Volume>(volAvg*2) // Top Reversal bar topRevBar = Volume[1]>volAvg and upBar[1] and wideRangeBar[1] and downBar and downClose and wideRangeBar and upmajor>0 and High=highest[10](High) PseudoUpThrust = (upBar[1])and High>High[1] and Volume[1]>1.5*volAvg and downBar and downClose and not upThrustBar pseudoUtCond = PseudoUpThrust[1] and downBar and downClose and not upThrustBar trendChange = upBar[1] and High=highest[5](High) and downBar and (downClose or midClose) and Volume>volAvg and upmajor>0 and upmid>0 and not wideRangeBar and not PseudoUpThrust //in a up market noDemandBarUt = upBar and narrowRangeBar and lowVolume and (aboveClose or upClose) and ((upminor>=0 and upmid>=0) or (upminor<=0 and upminor>=0)) // in a down or sidewayss market noDemandBarDt = upBar and narrowRangeBar and lowVolume and (aboveClose or upClose) and (upminor<=0 or upmid<=0) noSupplyBar = downBar and narrowRangeBar and lowVolume and midClose lowVolTest = low = lowest[5](low) and upClose and lowVolume lowVolTest1 = low = lowest[5](low) and Volume<volAvg and Low<Low[1] and upClose and upminor>0 and upmajor>0 lowVolTest2 = lowVolTest[1] and upBar and upClose sellCond1 = (upThrustCond1 or upThrustCond2 or upThrustCond3) sellCond2 = sellCond1[1]=0 sellCond = sellCond1 and sellCond2 strengthDown0 = upmajor<0 and volpos < 4 and downBar[1] and upBar and ClosePos>3 and upminor <0 and upmid <=0 // Strength after a down trend strengthDown = volpos<4 and downBar[1] and upBar and ClosePos>3 and upmid<=00 and upminor<0 strengthDown1 = upmajor<0 and Volume>(volAvg*1.5) and downBar[1] and upBar and ClosePos>3 and upmid<=0 and upminor<0 strengthDown2 = upmid<=0 and Volume[1]<volAvg and upBar and veryHighClose and volpos<4 buyCond1 = strengthDown or strengthDown1 buyCond = upBar and buyCond1[1] stopVolume = Low=lowest[5](Low) and (upClose or midClose) and Volume>1.5*volAvg and upmajor<0 revUpThrust = upBar and upClose and Volume>Volume[1] and Volume>volAvg and wideRangeBar and downBar[1] and downClose[1] and upminor<0 effortUp =High>High[1] and Low>Low[1] and Close>Close[1] and Close>=((High-Low)*0.7+Low) and spread>avgSpread and volpos<4 effortUpfail = effortUp[1] and (upThrustBar or upThrustCond1 or upThrustCond2 or upThrustCond3 or (downBar and AvgSpreadBar)) effortDown =High<High[1] and Low<Low[1] and Close<Close[1] and Close<=((High-Low)*0.25+Low) and wideRangeBar and Volume>Volume[1] effortDownFail = effortDown[1] and ((upBar and AvgSpreadBar) or revUpThrust or buyCond1) upflag = (sellCond or buyCond or effortUp or effortUpfail or stopVolume or effortDown or effortDownFail or revUpThrust or noDemandBarDt or noDemandBarUt or noSupplyBar or lowVolTest or lowVolTest1 or lowVolTest2 or bc) bullBar = (Volume>volAvg or Volume>Volume[1]) and Close<=((spread*0.2)+Low) and upBar and not upflag bearBar = vb and downClose and downBar and spread>avgSpread and not upflag //------------------------------------------------------// // Plot Shapes Section //------------------------------------------------------// if (upThrustBar or upThrustBartrue) and not effortUpfail and not sellCond and not bc then drawtext("▼",barindex,high+tr*0.35)coloured("darkred") endif UT1 = upThrustBar or upThrustBartrue if(upThrustCond1 or upThrustCond2 or nut)and not effortUpfail and not sellCond and not bc then drawtext("▼",barindex,high+tr*0.35)coloured("red") endif UT2 = upThrustCond1 or upThrustCond2 UT = UT1 or UT2 // if topRevBar and not sellCond and not UT and not effortUpfail then drawtext("▼",barindex,high+tr*0.35)coloured("orange") endif // TC if trendChange and not effortUpfail then drawtext("▼",barindex,high+tr*0.35)coloured(255,71,26) endif // PUT if PseudoUpThrust and not effortUpfail then drawtext("▼",barindex,high+tr*0.35)coloured(255,71,26) endif // PUC if pseudoUtCond and not effortUpfail then drawtext("▼",barindex,high+tr*0.35)coloured(255,71,26) endif // ND if noDemandBarUt then drawtext("︎●",barindex,high+tr*0.35)coloured(255,71,26) endif if noDemandBarDt then drawtext("︎●",barindex,high+tr*0.35)coloured(255,71,26) endif //NS if noSupplyBar then drawtext("︎●",barindex,low-tr*0.35)coloured("lime") endif // LVT if lowVolTest and not effortDownFail then drawtext("︎●",barindex,low-tr*0.35)coloured("lime") endif //ST if lowVolTest2 and not effortUp then drawtext("▲",barindex,low-tr*0.35)coloured("lime") endif lvt = lowVolTest or lowVolTest2 //-------------------------------------------------------// EFD = effortDownFail ST1 = strengthDown0 ST2 = strengthDown and not strengthDown2 strcond = strengthDown2 and not strengthDown0 and not strengthDown and not strengthDown1 ST3 = strengthDown1 ST4 = strengthDown2 and strcond ST5 = strengthDown2 and not strcond ST = ST1 or ST2 or ST3 or ST4 or ST5 //ST1 if strengthDown0 and not EFD and not effortUp and not stopVolume then drawtext("▲",barindex,low-tr*0.35)coloured("lime") endif //ST2 if strengthDown and not strengthDown2 and not EFD and not effortUp and not stopVolume then drawtext("▲",barindex,low-tr*0.35)coloured("lime") endif //ST3 if strengthDown1 and not EFD and not effortUp and not stopVolume then drawtext("▲",barindex,low-tr*0.35)coloured("lime") endif //st4 if strengthDown2 and strcond and not EFD and not effortUp and not stopVolume then drawtext("▲",barindex,low-tr*0.35)coloured("lime") endif //------------------------------------------------------// // SV if stopVolume and not ST then drawtext("︎●",barindex,low-tr*0.35)coloured("lime") endif // ST\nSV if stopVolume and ST then drawtext("︎●",barindex,low-tr*0.35)coloured("lime") endif // EU if effortUp and not ST and not buyCond and not effortDownFail then drawtext("▲",barindex,low-tr*0.35)coloured("lime") endif if effortUp and ST and not buyCond then drawtext("▲",barindex,low-tr*0.35)coloured("lime") endif // EUf if effortUp and ST and not buyCond then drawtext("▼",barindex,high+tr*0.35)coloured("red") endif //ED if effortDown and not effortUpfail then drawtext("▼",barindex,high+tr*0.35)coloured("red") endif //EDF if effortDownFail and not ST then drawtext("▲",barindex,low-tr*0.35)coloured("lime") endif if effortDownFail and ST then drawtext("▲",barindex,low-tr*0.35)coloured("lime") endif //RUT if revUpThrust and not ST then drawtext("▲",barindex,low-tr*0.35)coloured("lime") endif //BYC1 if buyCond and not ST and not effortUp and not lvt then drawtext("▲",barindex,low-tr*0.35)coloured("lime") endif //BYC3 if buyCond and not ST and effortUp then drawtext("▲",barindex,low-tr*0.35)coloured("lime") endif //SEC if sellCond and UT then drawtext("▼",barindex,high+tr*0.35)coloured("red") endif //BC if bc and not UT then drawtext("▼",barindex,high+tr*0.35)coloured("red") endif //BC UT\nBC if bc and UT then drawtext("▼",barindex,high+tr*0.35)coloured("red") endif //------------------------------------------------------// // BAR COLORING CODE //------------------------------------------------------// Vrg=average[30](volume)// average volume rg=(high-close) arg=average[30,2](rg) Vh=volume>volume[1] and volume[1]>volume[2] Cloc=close-low x=(high-low)/Cloc if Cloc=0 then x1=arg else x1=x endif Vb1 = volume >Vrg or volume > volume[1] ucls=x1<2 dcls=x1>2 mcls=x1<2.2 and x1>1.8 Vlcls=x1>4 Vhcls=x1<1.35 upbar = close > close[1] dnbar = close < close[1] CloseUp = close > close[1] CloseDn = close < close[1] VolUp = volume > volume[1] VolDn = volume < volume[1] bb1 = upbar and CloseUp and ucls and low > low[1] bb2 = upbar and VolUp bb3 = dnbar and CloseDn and VolDn bb4 = dnbar and CloseDn and close > close[1] db1 = dnbar and CloseDn and dcls db2 = dnbar and VolUp db3 = upbar and CloseDn and VolUp db4 = upbar and CloseDn and close<low[1] and dcls db5 = upbar and CloseUp and ucls and low<low[1] db6 = upbar and CloseUp and dcls bb=(bb1 or bb2 or bb3 or bb4) db=(db1 or db2 or db3 or db4 or db5 or db6) //neucolor = bkbg == true ? color.white : color.blue if bb and tls>0 then r=0 g=255 b=0 elsif db and tls<0 then r=255 g=0 b=0 elsif bkbg then r=255 g=255 b=255 else r=0 g=0 b=255 endif if bkbg then backgroundcolor("black") endif drawcandle(open, high, low, close)coloured(r,g,b) //------------------------------------------------------// return sma50 as "MA50" coloured("blue"), sma200 as "MA200" coloured("red")Thanks a lot Ivan – amazing – only question do you know if it is possible to have a “cheat sheet ” to know the definition of the signal to know separately the symbol which corresponds to the definition?
in TradingView they have below or above the symbol acronyms like EDF/SV but in my opinion no need as chart becomes too heavy – but just to know what symbol means what separately & one can keep it at hand?
Best
Fred
examples
EDF – Effort to Move Down Failed: Widespread / above average spread Bar closing up on High volume or above average volume appearing after ‘Effort to move down” bar.
This indicates that the Effort to move the pries down has failed. Bullish signalSV – Stopping Volume: A high volume medium to widespread Bar closing in the upper middle part in a down trend indicates that smart money is buying. This is an indication that the down trend is likely to end soon. Indicates strength
Hi, Of course, you would have to add an extra line on each line. Here is an example:
//BC
if bc and not UT then
drawtext("▼",barindex,high+tr*0.35)coloured("red")
drawtext("BC",barindex,high+tr*0.45)coloured("red")
endif
You will have to test the value to multiply by
trso that it looks good visually. I'll leave that up to you 🙂 -
AuthorPosts
- You must be logged in to reply to this topic.
VPA Indicator & Volume Spread Analysis
ProBuilder: Indicators & Custom Tools
Summary
This topic contains 8 replies,
has 4 voices, and was last updated by ![]() Iván González
Iván González
1 year, 2 months ago.
Topic Details
| Forum: | ProBuilder: Indicators & Custom Tools |
| Language: | English |
| Started: | 01/17/2025 |
| Status: | Active |
| Attachments: | 1 files |
About personal data collected
The information collected on this form is stored in a computer file by ProRealCode to create and access your ProRealCode profile. This data is kept in a secure database for the duration of the member's membership. They will be kept as long as you use our services and will be automatically deleted after 3 years of inactivity. Your personal data is used to create your private profile on ProRealCode. This data is maintained by SAS ProRealCode, 407 rue Freycinet, 59151 Arleux, France. If you subscribe to our newsletters, your email address is provided to our service provider "MailChimp" located in the United States, with whom we have signed a confidentiality agreement. This company is also compliant with the EU/Swiss Privacy Shield, and the GDPR. For any request for correction or deletion concerning your data, you can directly contact the ProRealCode team by email at privacy@prorealcode.com If you would like to lodge a complaint regarding the use of your personal data, you can contact your data protection supervisory authority.