WF testing rising price indices.
Forums › ProRealTime English forum › General trading discussions › WF testing rising price indices.
- This topic has 6 replies, 3 voices, and was last updated 7 years ago by
 Vonasi.
-
-
06/24/2018 at 6:10 PM #74259
I’ve been thinking (yes I know I probably shouldn’t) about walk forward testing following my comments here:
https://www.prorealcode.com/topic/back-testing-strategies/page/2/#post-74054
If an index steadily rises over time then the average bar range will also increase and also 1% of closing price at a higher price will obviously be bigger than 1% at a lower price. If a strategy has exits based on % of price or bar range then a walk forward test on this kind of market should see an improvement in performance with each OOS period compared to the IS as the test gets closer to the current day and price is increasing.
We have all been taught to look for consistent results across a WF test when in reality on a rising price index we should be looking for improving results. This improving OOS performance would normally be considered a sign of possible curve fitting whereas in fact a steady improvement in line with a rising price is what we actually should be looking for if using % of price or range based exits.
Just had to put my thoughts out there….. comments welcome.
1 user thanked author for this post.
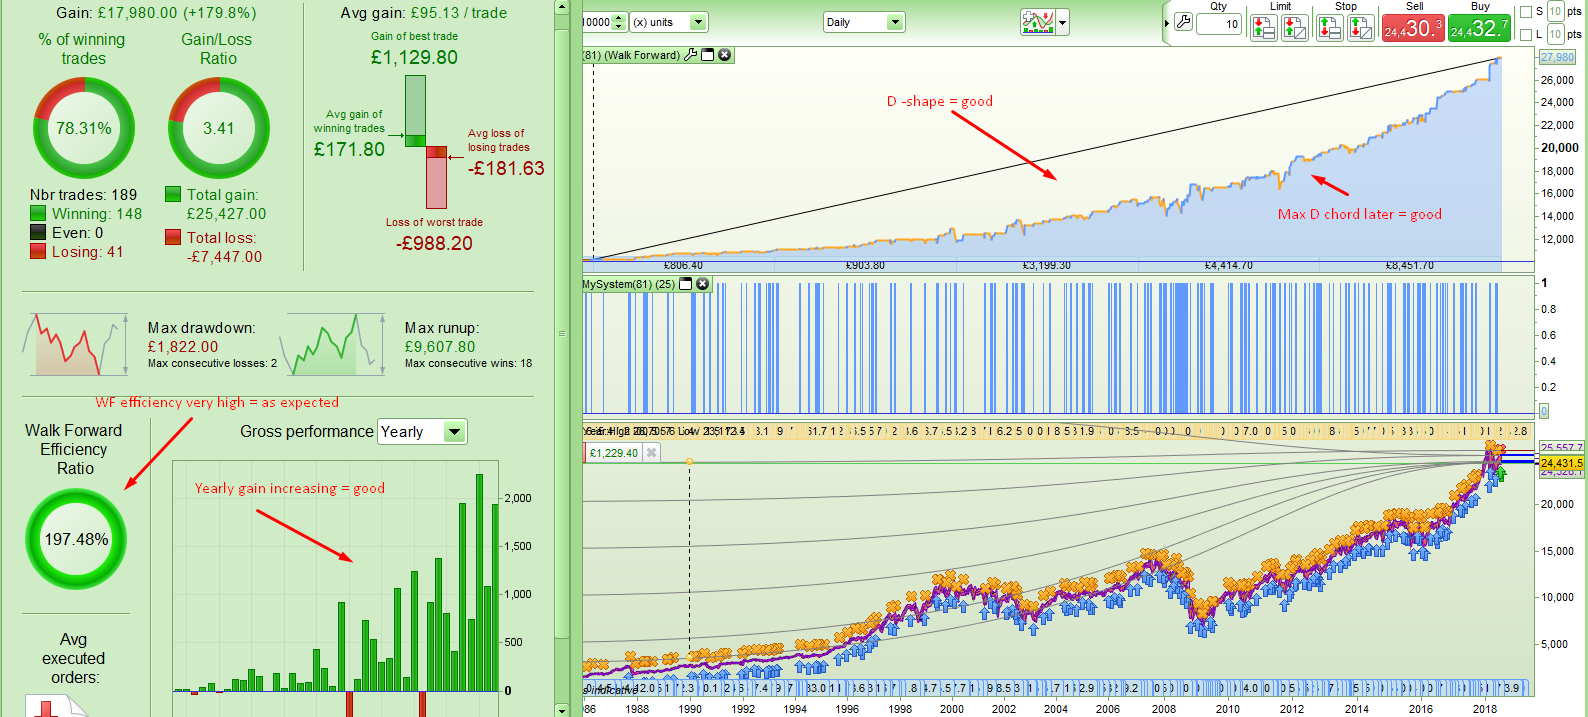
06/25/2018 at 1:23 PM #74313I thought I would provide an example of what I mean. This is a strategy on the DJI which is what i would refer to as a rising price index with a 50/50 x 5 not anchored WF test:
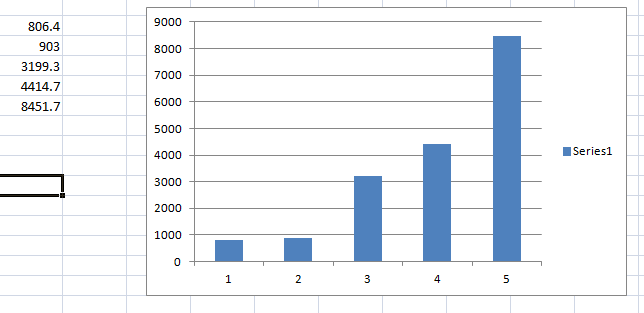
….and each out of sample period gain plotted in Excel:
This in my mind is a good WF result even if we would normally be taught to consider an overall WF efficiency ratio of 200% to be a bad result and non level gains to be bad.
06/25/2018 at 1:50 PM #7431906/25/2018 at 1:55 PM #74320You’re an all round genius!
Not yet but I am working on it. It has been a very long project so far……
06/25/2018 at 7:02 PM #74341So you only want to prove that a percentage of price exit make more profits nowadays than in the past? Sorry but I read many times your first post and I’m still not sure of what you are explaining here 😉 too much sun on my bold head I presume..
06/25/2018 at 7:24 PM #74344I’m trying to show that level OS WF gains in a market such as the DJI where prices and range historically increase are actually the sign of a failing strategy and increasing gains in each OS period is what you should be looking for. This is obviously only if the strategy has exits based on percentage of price or exits connected to range or highs and lows.
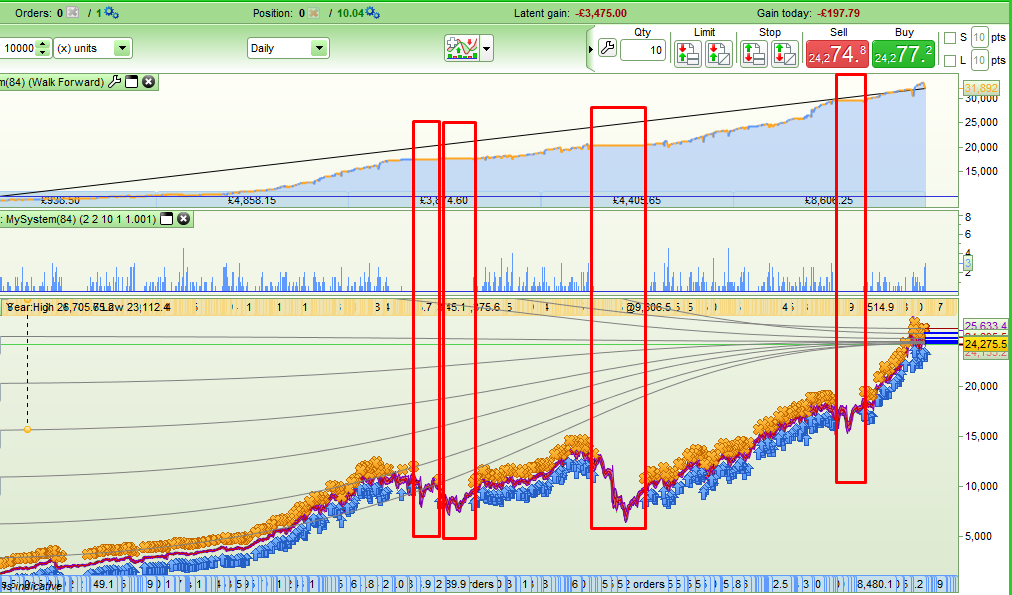
06/27/2018 at 1:14 PM #74530Another issue that we should be aware when WF testing is the inaccuracies when testing any strategy with a filter in it that stops the strategy trading in for example bear markets. This filter means that some IS and OSS periods may actually be not trading at all for large parts of the sample being tested. On these sort of strategies getting anything meaningful from WF testing can be virtually impossible.
Here is an example also on the DJI. there are four periods where the strategy was not on the market at all and they are not of equal size or spread evenly throughout the test and so WF test results are pretty meaningless.
-
AuthorPosts
Find exclusive trading pro-tools on 


