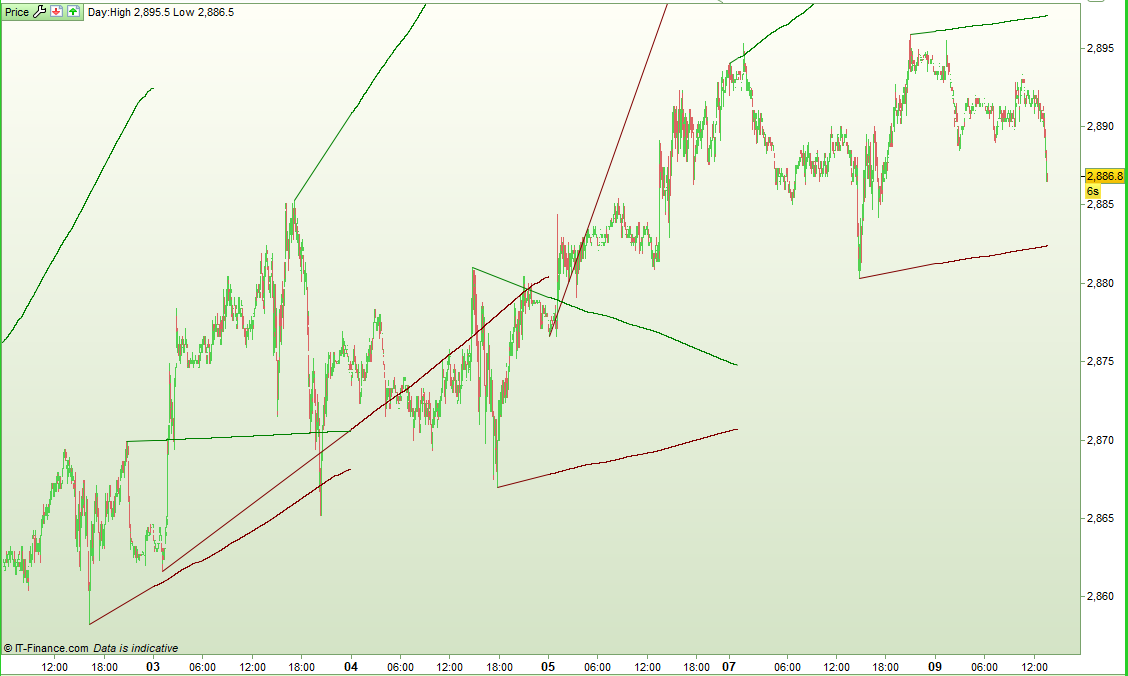
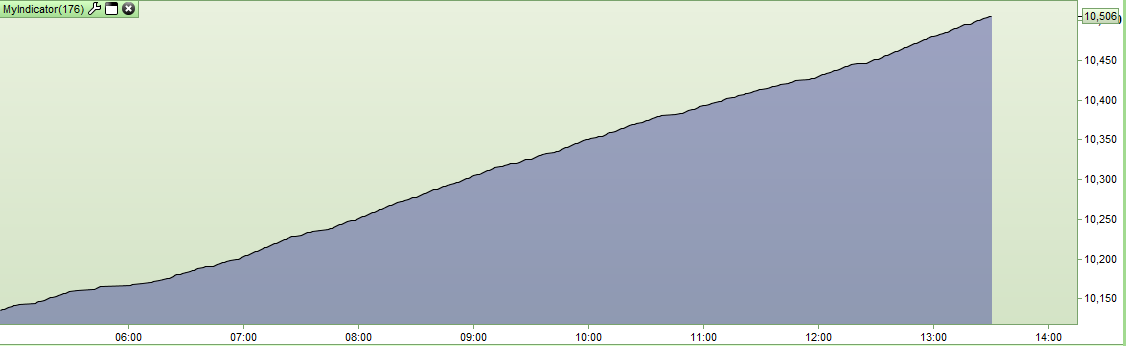
I have just coded an indicator that at the first candle of a day draws lines connecting the last two days HH and LL’s and then projects them forward. It does this by calculating the difference in height from the start of the line to the end of the line and dividing it by the number of candles between the ends to give a quantity to add or subtract on each future bar. For some reason and especially on faster time frame charts the projected lines can go a bit wobbly or stepped and I was trying to work out why. I assume it is because of missing candles as if you return barindex as an indicator on a fast time frame chart the barindex line is not straight but also wobbly!
It would be nice if we had an index that counted gaps so we could project straight lines forward or is there a workaround for this barindex issue?