Bonjour,
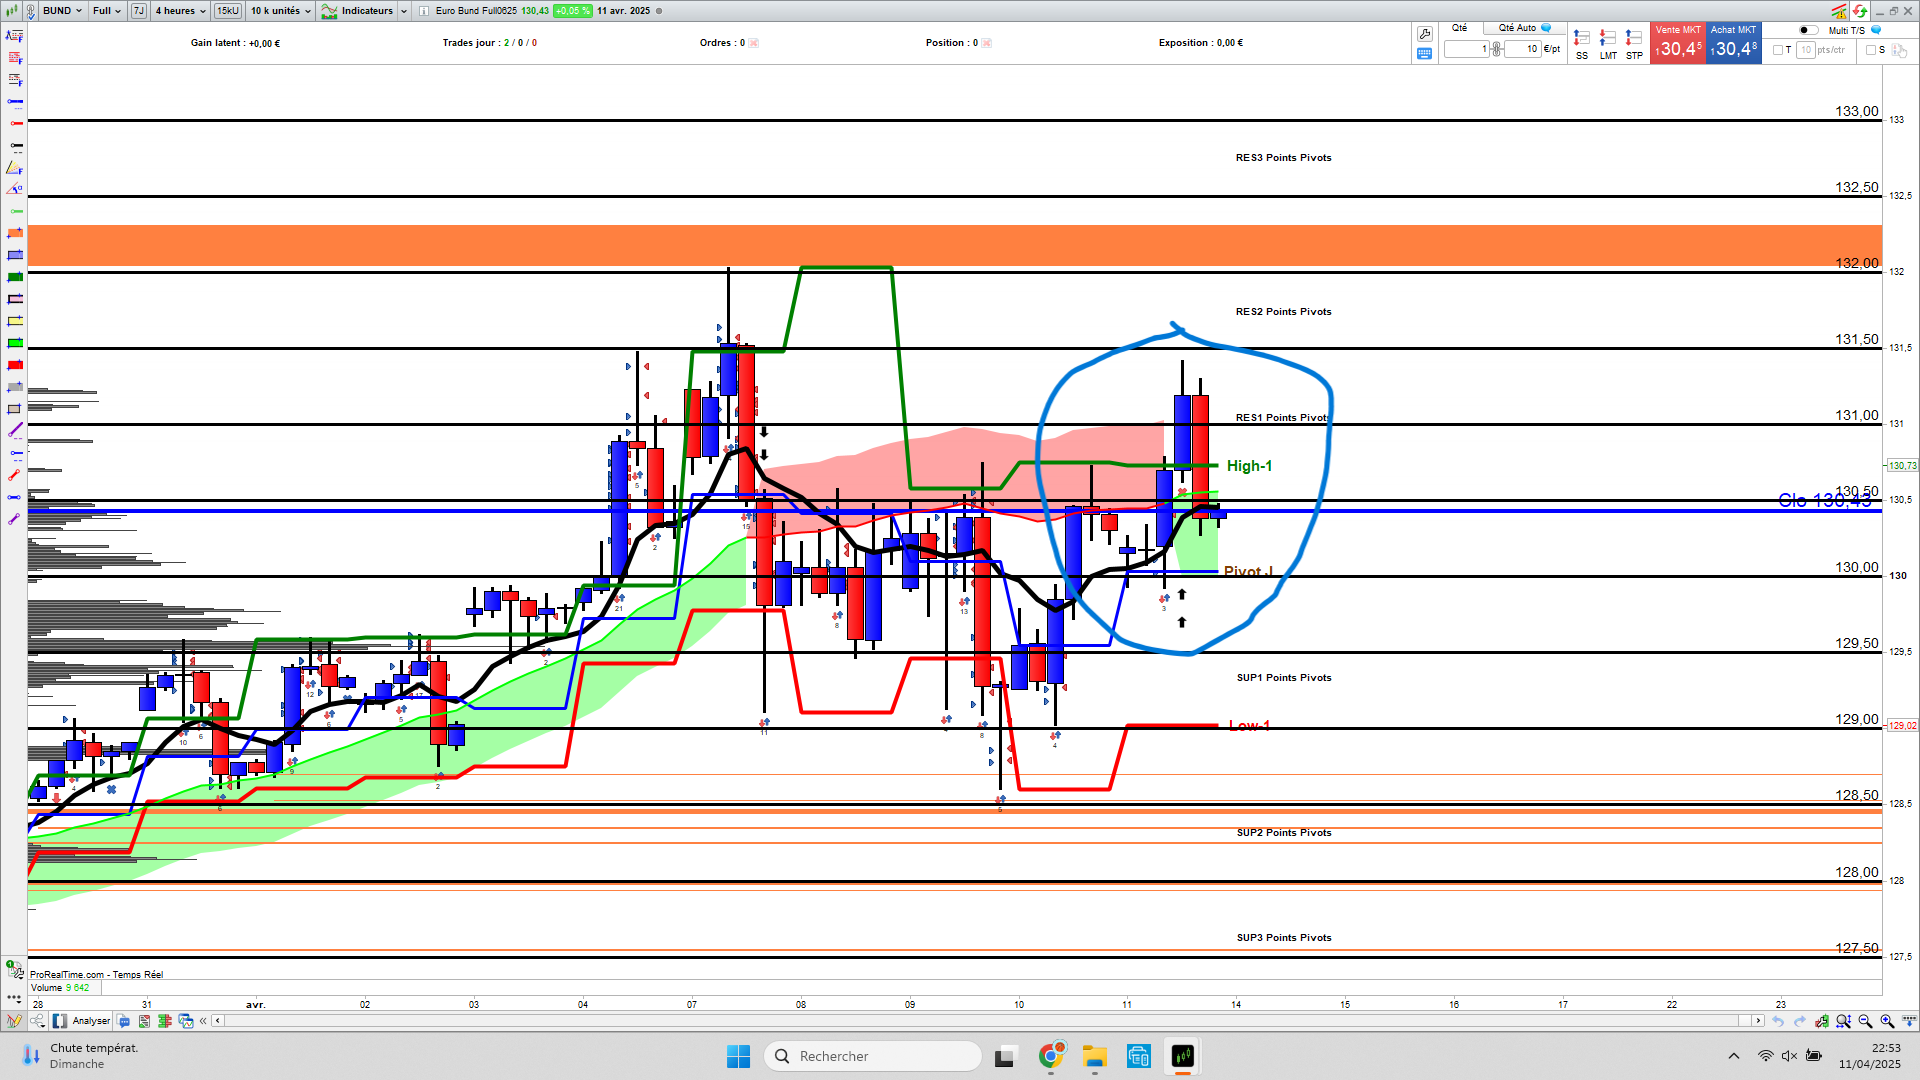
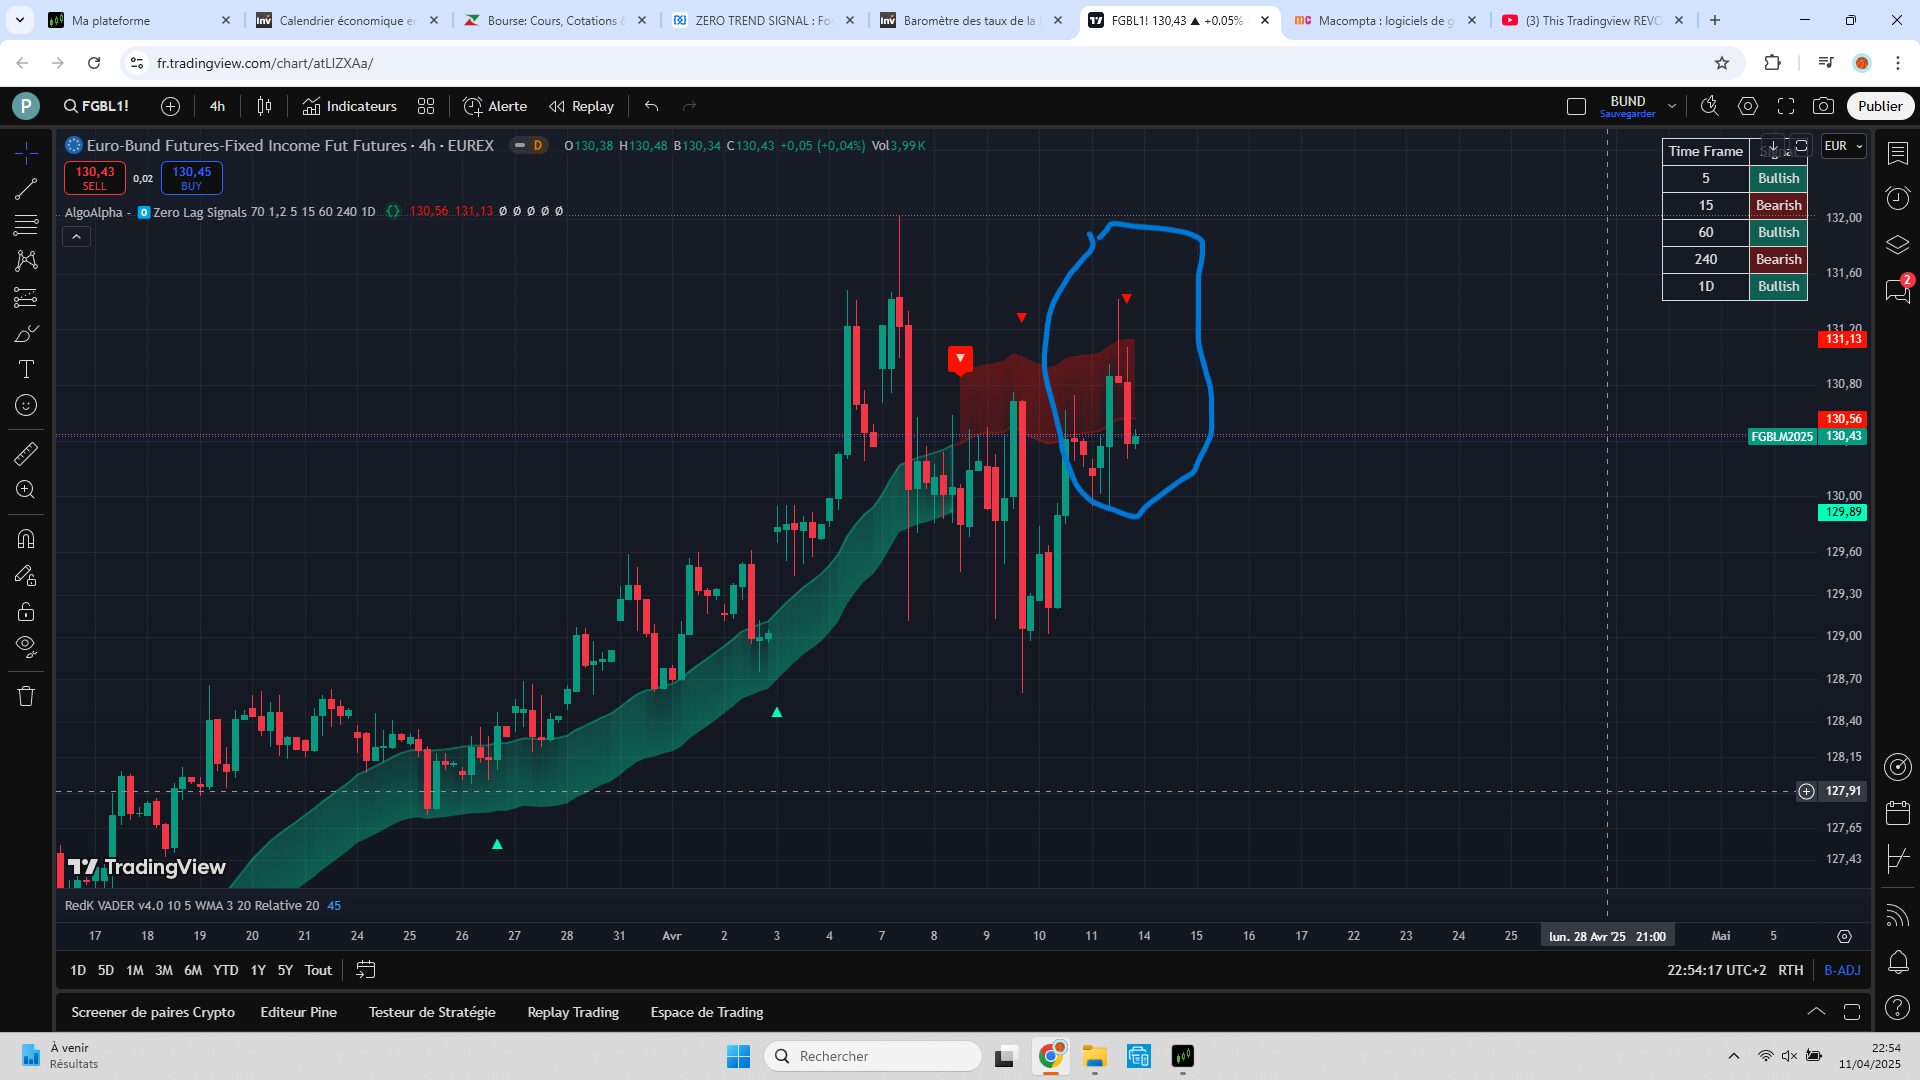
Voici deux prises d’écran avec le même indicateur “ZERO LAG TRENDS SIGNALS”
Origine tradingview et traduit sur PRT. On s’aperçoit qu’avec le code PRT on a un changement alors qu’il est inexistant sur tradingview.
Que se passe-t-il ?
merci
//-------------------------------------//
//PRC_Zero Lag Trend Signals
//version = 0
//15.11.24
//Iván González @ www.prorealcode.com
//Sharing ProRealTime knowledge
//-------------------------------------//
//---Inputs
//-------------------------------------//
//length=70 // appliqués dans les variables
//mult=1.2 // appliqués dans les variables
src=close
//-------------------------------------//
// Zlema calculation
//-------------------------------------//
lag=floor((length-1)/2)

myzlema=average[length,1](src+(src-src[lag]))
//-------------------------------------//
// Volatility calculation
//-------------------------------------//
atr=averagetruerange[length](close)
volatil=highest[length*3](atr)*mult
//-------------------------------------//
// Trend condition
//-------------------------------------//
once trend=0
if close crosses over myzlema+volatil then
trend=1
r=0
g=255
elsif close crosses under myzlema-volatil then
trend=-1
r=255
g=0
endif
//-------------------------------------//
// Signals and colors
//-------------------------------------//
if trend=-1 then
upper=myzlema+volatil
alpha1=90
lower=myzlema
alpha2=0
if trend<>trend[1] then
drawarrowdown(barindex,upper+0.25*atr)coloured(0,0,0)
drawarrowdown(barindex,upper+0.65*atr)coloured(0,0,0)
endif
else
upper=myzlema
alpha1=0
lower=myzlema-volatil
alpha2=90
if trend<>trend[1] then
drawarrowup(barindex,lower-0.25*atr)coloured(0,0,0)
drawarrowup(barindex,lower-0.65*atr)coloured(0,0,0)
endif
endif

//if close crosses over myzlema and trend=1 and trend[1]=1 then
//drawtext("▲",barindex,myzlema-vo/ myzlema and trend=-1 and trend[1]=-1 then
//drawtext("▼",barindex,myzlema+volatil*1.5)coloured("red")
//endif
if barindex > 4*length then
colorbetween(myzlema,upper,r,g,0,alpha1)
colorbetween(myzlema,lower,r,g,0,alpha2)
endif
//-------------------------------------//
return myzlema as "Zero Lag Trends Signals"style(line,2)coloured(r,g,0)
et le code tradingview
// This Pine Script™ code is subject to the terms of the Mozilla Public License 2.0 at https://mozilla.org/MPL/2.0/
// © AlgoAlpha

//@version=5
indicator("Zero Lag Trend Signals (MTF) [AlgoAlpha]", shorttitle="AlgoAlpha - 0️⃣Zero Lag Signals", overlay=true)

length = input.int(70, "Length", tooltip = "The Look-Back window for the Zero-Lag EMA calculations", group = "Main Calculations")
mult = input.float(1.2, "Band Multiplier", tooltip = "This value controls the thickness of the bands, a larger value makes the indicato less noisy", group = "Main Calculations")
t1 = input.timeframe("5", "Time frame 1", group = "Extra Timeframes")
t2 = input.timeframe("15", "Time frame 2", group = "Extra Timeframes")
t3 = input.timeframe("60", "Time frame 3", group = "Extra Timeframes")
t4 = input.timeframe("240", "Time frame 4", group = "Extra Timeframes")
t5 = input.timeframe("1D", "Time frame 5", group = "Extra Timeframes")
green = input.color(#00ffbb, "Bullish Color", group = "Appearance")
red = input.color(#ff1100, "Bearish Color", group = "Appearance")

src = close

lag = math.floor((length - 1) / 2)

zlema = ta.ema(src + (src - src[lag]), length)

volatility = ta.highest(ta.atr(length), length*3) * mult

var trend = 0

if ta.crossover(close, zlema+volatility)
    trend := 1

if ta.crossunder(close, zlema-volatility)
    trend := -1

zlemaColor = trend == 1 ? color.new(green, 70) : color.new(red, 70)
m = plot(zlema, title="Zero Lag Basis", linewidth=2, color=zlemaColor)
upper = plot(trend == -1 ? zlema+volatility : na, style = plot.style_linebr, color = color.new(red, 90), title = "Upper Deviation Band")
lower = plot(trend == 1 ? zlema-volatility : na, style = plot.style_linebr, color = color.new(green, 90), title = "Lower Deviation Band")

fill(m, upper, (open + close) / 2, zlema+volatility, color.new(red, 90), color.new(red, 70))
fill(m, lower, (open + close) / 2, zlema-volatility, color.new(green, 90), color.new(green, 70))

plotshape(ta.crossunder(trend, 0) ? zlema+volatility : na, "Bearish Trend", shape.labeldown, location.absolute, red, text = "▼", textcolor = chart.fg_color, size = size.small)
plotshape(ta.crossover(trend, 0) ? zlema-volatility : na, "Bullish Trend", shape.labelup, location.absolute, green, text = "▲", textcolor = chart.fg_color, size = size.small)

plotchar(ta.crossover(close, zlema) and trend == 1 and trend[1] == 1 ? zlema-volatility*1.5 : na, "Bullish Entry", "▲", location.absolute, green, size = size.tiny)
plotchar(ta.crossunder(close, zlema) and trend == -1 and trend[1] == -1 ? zlema+volatility*1.5 : na, "Bearish Entry", "▼", location.absolute, red, size = size.tiny)

s1 = request.security(syminfo.tickerid, t1, trend)
s2 = request.security(syminfo.tickerid, t2, trend)
s3 = request.security(syminfo.tickerid, t3, trend)
s4 = request.security(syminfo.tickerid, t4, trend)
s5 = request.security(syminfo.tickerid, t5, trend)

s1a = s1 == 1 ? "Bullish" : "Bearish"
s2a = s2 == 1 ? "Bullish" : "Bearish"
s3a = s3 == 1 ? "Bullish" : "Bearish"
s4a = s4 == 1 ? "Bullish" : "Bearish"
s5a = s5 == 1 ? "Bullish" : "Bearish"

if barstate.islast
    var data_table = table.new(position=position.top_right, columns=2, rows=6, bgcolor=chart.bg_color, border_width=1, border_color=chart.fg_color, frame_color=chart.fg_color, frame_width=1)
    table.cell(data_table, text_halign=text.align_center, column=0, row=0, text="Time Frame", text_color=chart.fg_color)
    table.cell(data_table, text_halign=text.align_center, column=1, row=0, text="Signal", text_color=chart.fg_color)

    table.cell(data_table, text_halign=text.align_center, column=0, row=1, text=t1, text_color=chart.fg_color)
    table.cell(data_table, text_halign=text.align_center, column=1, row=1, text=s1a, text_color=chart.fg_color, bgcolor=s1a == "Bullish" ? color.new(green, 70) : color.new(red, 70))

    table.cell(data_table, text_halign=text.align_center, column=0, row=2, text=t2, text_color=chart.fg_color)
    table.cell(data_table, text_halign=text.align_center, column=1, row=2, text=s2a, text_color=chart.fg_color, bgcolor=s2a == "Bullish" ? color.new(green, 70) : color.new(red, 70))

    table.cell(data_table, text_halign=text.align_center, column=0, row=3, text=t3, text_color=chart.fg_color)
    table.cell(data_table, text_halign=text.align_center, column=1, row=3, text=s3a, text_color=chart.fg_color, bgcolor=s3a == "Bullish" ? color.new(green, 70) : color.new(red, 70))

    table.cell(data_table, text_halign=text.align_center, column=0, row=4, text=t4, text_color=chart.fg_color)
    table.cell(data_table, text_halign=text.align_center, column=1, row=4, text=s4a, text_color=chart.fg_color, bgcolor=s4a == "Bullish" ? color.new(green, 70) : color.new(red, 70))

    table.cell(data_table, text_halign=text.align_center, column=0, row=5, text=t5, text_color=chart.fg_color)
    table.cell(data_table, text_halign=text.align_center, column=1, row=5, text=s5a, text_color=chart.fg_color, bgcolor=s5a == "Bullish" ? color.new(green, 70) : color.new(red, 70))

/////////////////////////////////////////ALERTS FOR SMALL ARROWS (ENTRY SIGNALS)
alertcondition(ta.crossover(close, zlema) and trend == 1 and trend[1] == 1, "Bullish Entry Signal",
     message="Bullish Entry Signal detected. Consider entering a long position.")
alertcondition(ta.crossunder(close, zlema) and trend == -1 and trend[1] == -1, "Bearish Entry Signal",
     message="Bearish Entry Signal detected. Consider entering a short position.")

/////////////////////////////////////////ALERTS FOR TREND CONDITIONS
alertcondition(ta.crossover(trend, 0), "Bullish Trend")
alertcondition(ta.crossunder(trend, 0), "Bearish Trend")
alertcondition(ta.cross(trend, 0), "(Bullish or Bearish) Trend")

alertcondition(ta.crossover(s1, 0), "Bullish Trend Time Frame 1")
alertcondition(ta.crossunder(s1, 0), "Bearish Trend Time Frame 1")
alertcondition(ta.cross(s1, 0), "(Bullish or Bearish) Trend Time Frame 1")

alertcondition(ta.crossover(s2, 0), "Bullish Trend Time Frame 2")
alertcondition(ta.crossunder(s2, 0), "Bearish Trend Time Frame 2")
alertcondition(ta.cross(s2, 0), "(Bullish or Bearish) Trend Time Frame 2")

alertcondition(ta.crossover(s3, 0), "Bullish Trend Time Frame 3")
alertcondition(ta.crossunder(s3, 0), "Bearish Trend Time Frame 3")
alertcondition(ta.cross(s3, 0), "(Bullish or Bearish) Trend Time Frame 3")

alertcondition(ta.crossover(s4, 0), "Bullish Trend Time Frame 4")
alertcondition(ta.crossunder(s4, 0), "Bearish Trend Time Frame 4")
alertcondition(ta.cross(s4, 0), "(Bullish or Bearish) Trend Time Frame 4")

alertcondition(ta.crossover(s5, 0), "Bullish Trend Time Frame 5")
alertcondition(ta.crossunder(s5, 0), "Bearish Trend Time Frame 5")
alertcondition(ta.cross(s5, 0), "(Bullish or Bearish) Trend Time Frame 5")

alertcondition(ta.crossover(close, zlema) and trend == 1 and trend[1] == 1, "Bullish Entry")
alertcondition(ta.crossunder(close, zlema) and trend == -1 and trend[1] == -1, "Bearish Entry")