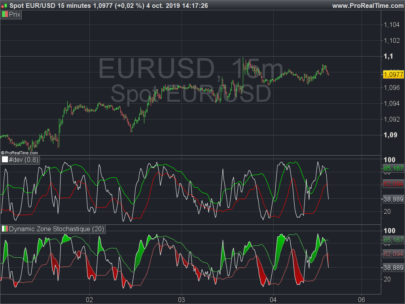
Returns the upper line of the Dynamic Zone Stochastic indicator.
The Dynamic Zone Stochastic oscillator is similar to a classic stochastic with Bollinger Bands of 0.8 standard deviation applied on it.
Syntax:
|
1 |
dynamiczonestochasticup[BBperiod](price) |
Where:
- BBperiod: calculation period of the Bollinger Bands applied to the Stochastic (default is 20 periods)
The stochastic period is standard, set to default [14,3] and cannot be changed.
DYNAMIC ZONE STOCHASTIC The “Dynamic Zone Stochastic” is an oscillator from 0 to 100 that indicates zones where the security is “overbought” or “oversold”. Unlike the classical Stochastic, the zones where the security is “overbought” or “oversold” are dynamic rather than fixed. Interpretation:
If the Stochastic is higher than the upper level, the value is “overbought” and a bearish signal is given. On the other hand, if the Stochastic is lower than the lower level, the security is “oversold” and a bullish signal is given.
A bullish signal is generated when the Stochastic crosses over the lower level.
A bearish signal is generated when the Stochastic crosses under the upper level.
Example:
|
1 2 3 4 |
a = DynamicZoneStochasticUp[20](close) b = DynamicZoneStochasticDown[20](close) return a coloured(0,255,0) style(line,1), b coloured(255,0,0) style(line,1),Stochastic[14,3](close) |
The upper line of the dynamic zone Stochastic is the same as:
|
1 |
c = average[20](Stochastic[14,3](close))+std[20](Stochastic[14,3](close))*0.8 |
 DynamicZoneStochasticUp