

Cumulative Volume ZigZag (live version)
June 26, 2023, 10:16 AM
Indicators
5 Comments
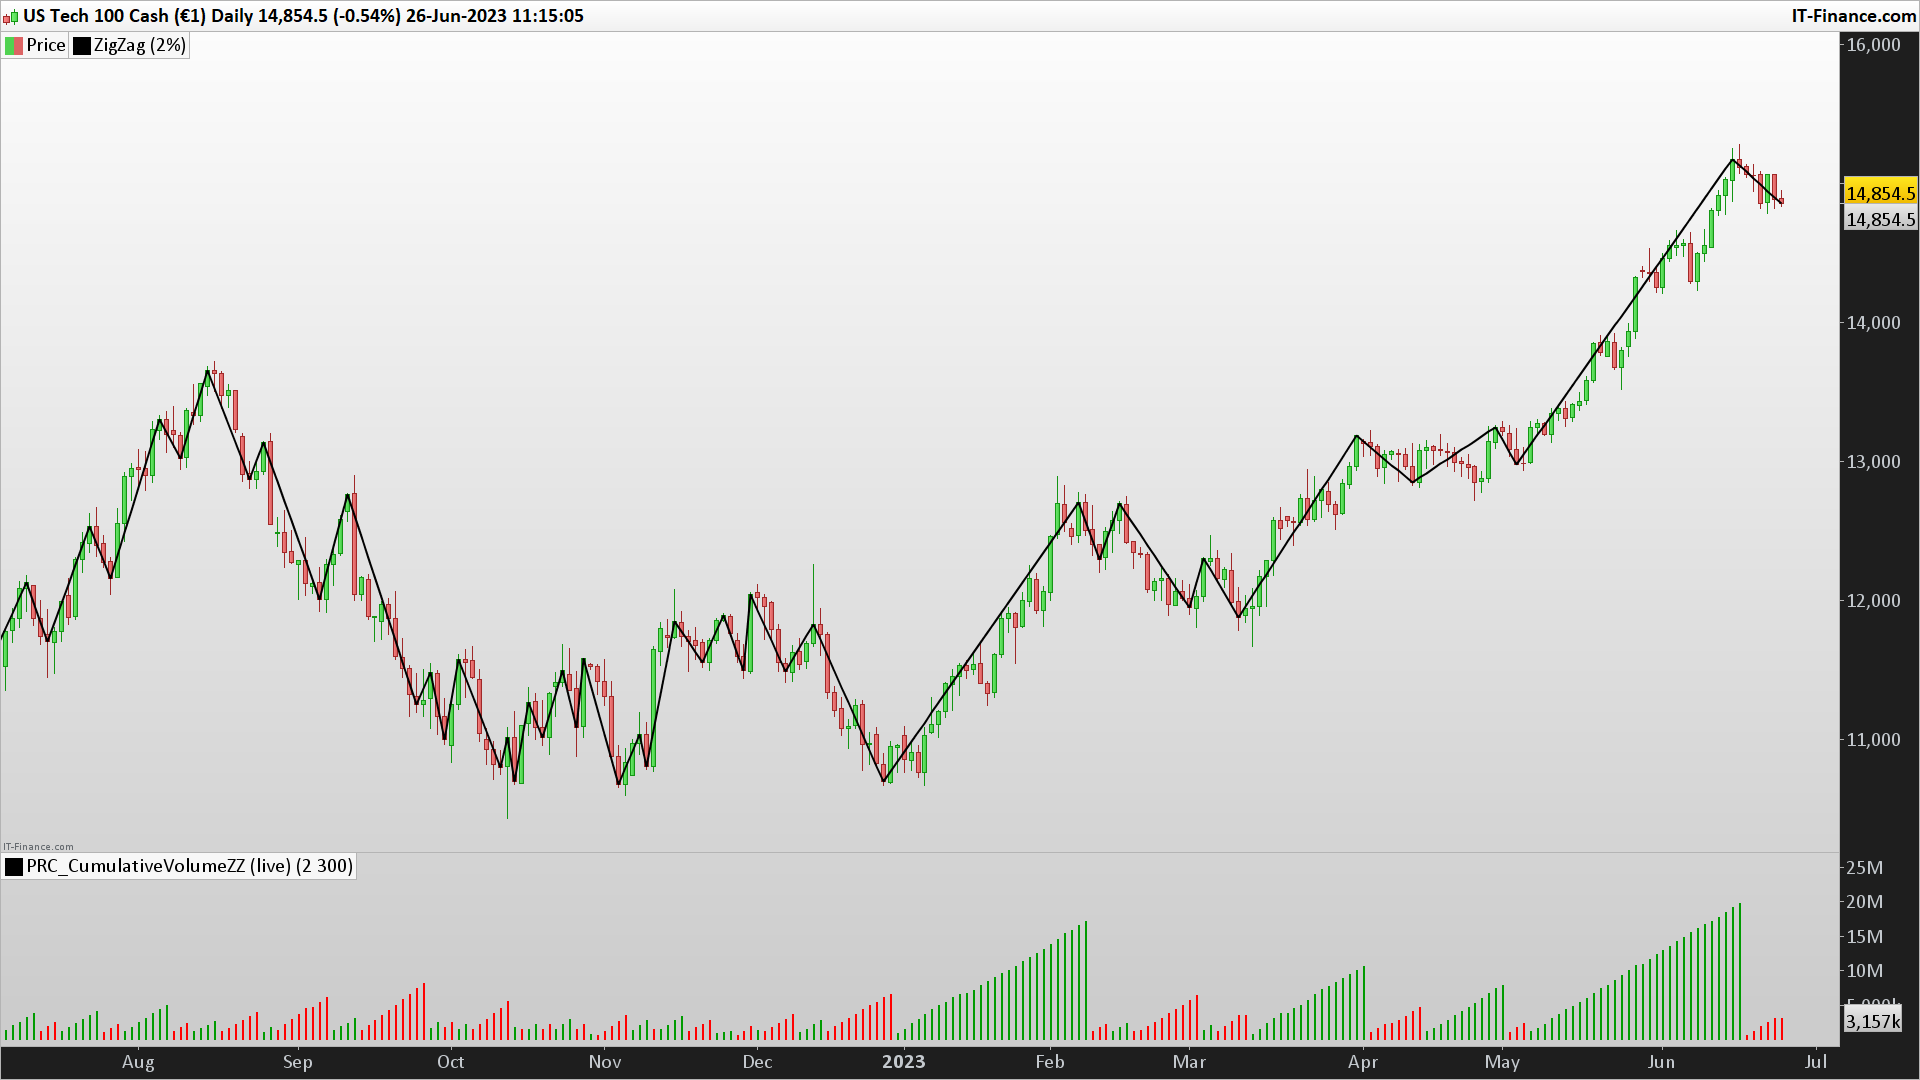
This Cumulative Volume indicator helps in understanding the change in volume related to peaks and troughs (referred to as ‘tough’ in the code) of price movement based on the ZigZag indicator.
Here is a detailed explanation of the code:
defparam drawonlastbaronly=true: This line sets the parameter to draw the indicator only on the last bar of the chart to save computation resources.- The parameters are set:
percentVariationis set to 0.04, which defines the minimum price change necessary for the ZigZag indicator to alter its direction.BarsLimitis set to 200, which is the maximum number of bars for which the histogram is drawn. zz = ZigZag[percentVariation](close): This line calculates the ZigZag indicator based on the closing prices and the percent variation defined.peak = zz<zz[1] and zz[1]>zz[2]andtough = zz>zz[1] and zz[1]<zz[2]are lines that define conditions for identifying peaks and troughs. A peak is identified when the current ZigZag value is less than the previous value and the previous value was greater than the one before it. Similarly, a trough is identified when the current ZigZag value is greater than the previous one and the previous value was less than the one before it.cumV = cumV+volume: This line is used to calculate the cumulative volume up to the current bar.- The array
$barvolis used to store the cumulative volume for each bar. The$barcolorarray is used to store the color for the current trend. - If a peak or trough is identified, the cumulative volume (
cumV) is reset to the current bar’s volume, and the trend color (color) is set accordingly. If a peak is identified,coloris set to -1, indicating a downward trend. If a trough is identified,coloris set to 1, indicating an upward trend. - The
if islastbarupdate thenblock is executed on every last bar update. It draws rectangles on the lastBarsLimitnumber of bars based on the stored volumes and colors. return cumV coloured(0,0,0,0): This line is to return the current cumulative volume as the value of the indicator. The color of this line is set to transparent (all zeros), meaning that the line won’t be visible on the chart. The visual representation of this indicator is done by the rectangles drawn in the previous step.
This code will effectively create a volume histogram where the color of each bar represents the direction of the trend, and the height of the bar represents the cumulative volume of the trend. Peaks and troughs will reset the cumulative volume, starting a new bar in the histogram.
//PRC_CumulativeVolume ZigZag (live) | indicator
//26.06.23
//Nicolas @ www.prorealcode.com
//Sharing ProRealTime knowledge

defparam drawonlastbaronly=true

// — parameters
percentVariation = 0.04
BarsLimit = 200 //how many historgram to draw?
// -----

zz = ZigZag[percentVariation](close)

peak = zz<zz[1] and zz[1]>zz[2]
tough = zz>zz[1] and zz[1]<zz[2]

cumV = cumV+volume

$barvol[barindex]=cumv //store in an array the current volume for that bar
$barcolor[barindex]=color //color of current trend

if peak then
 cumV = Volume
 color = -1
elsif tough then
 cumV = Volume
 color = 1
endif

if islastbarupdate then
 a = 0
 for i = barindex downto barindex-barslimit do
  r=255
  g=0
  if $barcolor[i]>0 then
   r=0
   g=155
  endif
  drawrectangle(barindex[a],$barvol[i],barindex[a],0) coloured(r,g,0)
  a=a+1
 next
endif

return cumV coloured(0,0,0,0)
Download
Filename:
PRC_CumulativeVolumeZZ-live-1.itf
Downloads:
167
Download
Filename:
PRC_CumulativeVolumeZZ-live.itf
Downloads:
126
Legend
I created ProRealCode because I believe in the power of shared knowledge. I spend my time coding new tools and helping members solve complex problems.
If you are stuck on a code or need a fresh perspective on a strategy, I am always willing to help. Welcome to the community!
Author’s Profile
Loading...