This indicator identifies different interesting configurations
on volumes and especially on the appearance of “pocket pivots”.
As describe by Gil Morales et Chris Kacher in their book “Trade like an O’Neil disciple” ,
a “pocket pivot” volume is an up day volume that is greater than the highest down volume day of the last 10 down days.
Also this indicator try to identify “distribution day” and can help to regnonize instutionnal selling.
O’Neil referred to these days as ” heavy volume, without further price progress higher. “.
I use these criterias to identify them : price drop greater than 0.2 % on heavier volume than the prior day
Clusters are more relevant than a ditribution day here and there.
When the bar count reaches 5-7 be on guard. Note that price can continue uptrends even with an elevated distribution bar counts.
Also closing range matters
Distribution days are erased when price index rises 5% from a ditribution day
or after 25 trading days have passed.
Disclaimer : this indicator is not a buying signal, it simply gives a sense of institutional buying or selling pressure and must imperatively be analyzed according to many others parameters (trend, price, stage, stock fundamentals…)
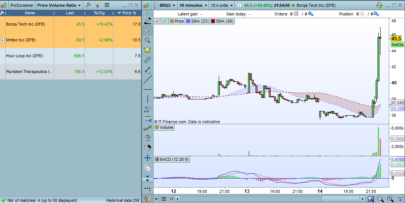
Here is the meaning of the different graphical elements rendered by this indicator :
Green bars : 10 day pocket pivots
Blue bars : 5 day pocket pivots
Dark gray bars : dow volume days bars
Light gray bars : up volume days bars
Red bars : distribution bars
Orange line : average volume over the last 50 days.
Orange Down Arrows on average line : dry volume < 45 % of the 50 days average volume
Enhanced Volume Pocket Pivot
Version 1.0
Author : TeamOne (https://www.prorealcode.com/user/teamone/)
Date : 2022/04/02
|
1 2 3 4 5 6 7 8 9 10 11 12 13 14 15 16 17 18 19 20 21 22 23 24 25 26 27 28 29 30 31 32 33 34 35 36 37 38 39 40 41 42 43 44 45 46 47 48 49 50 51 52 53 54 55 56 57 58 59 60 61 62 63 64 65 66 67 68 69 70 71 72 73 74 75 76 77 78 79 80 81 82 83 84 85 86 87 88 89 90 91 92 |
// // Enhanced Volume Pocket Pivot // Version 1.0 // Author : TeamOne (https://www.prorealcode.com/user/teamone/) // Date : 2022/04/02 // // This indicator identifies different interesting configurations // on volumes and especially on the appearance of "pocket pivots". // As describe by Gil Morales et Chris Kacher in their book "Trade like an O'Neil disciple" , // a "pocket pivot" volume is an up day volume that is greater than the highest down volume day of the last 10 down days. // // Also this indicator try to identify "distribution day" and can help to regnonize instutionnal selling. // O’Neil referred to these days as " heavy volume, without further price progress higher. ". // I use these criterias to identify them : price drop greater than 0.2 % on heavier volume than the prior day // Clusters are more relevant than a ditribution day here and there. // When the bar count reaches 5-7 be on guard. Note that price can continue uptrends even with an elevated distribution bar counts. // Also closing range matters // Distribution days are erased when price index rises 5% from a ditribution day // or after 25 trading days have passed. // // // Disclaimer : this indicator is not a buying signal, it simply gives a sense of institutional buying or selling pressure and must imperatively be // analyzed according to many others parameters (trend, price, stage, stock fundamentals...) // // Here is the meaning of the different graphical elements rendered by this indicator : // Green bars : 10 day pocket pivots // Blue bars : 5 day pocket pivots // Dark gray bars : dow volume days bars // Light gray bars : up volume days bars // Red bars : distribution bars // Orange line : average volume over the last 50 days. // Orange Down Arrows on average line : dry volume < 45 % of the 50 days average volume // // avgVolume = Average[50](Volume) // is current bar a 10 days pocket pivot ? isPP10 = Close > Close[1] AND Volume > ABS(Close[1] < Close[2]) * Volume[1] AND Volume > ABS(Close[2] < Close[3]) * Volume[2] AND Volume > ABS(Close[3] < Close[4]) * Volume[3] AND Volume > ABS(Close[4] < Close[5]) * Volume[4] AND Volume > ABS(Close[5] < Close[6]) * Volume[5] AND Volume > ABS(Close[6] < Close[7]) * Volume[6] AND Volume > ABS(Close[7] < Close[8]) * Volume[7] AND Volume > ABS(Close[8] < Close[9]) * Volume[8] AND Volume > ABS(Close[9] < Close[10]) * Volume[9] AND Volume > ABS(Close[10] < Close[11]) * Volume[10] // is current day price above last day price ? isAnUpDay = Close > Close[1] // is current day a distribution day ? closeLocationValue = ((Close-Low)-(High-Close))/(High-Low) //A value of zero would mean that the price closed halfway between the high and low of the range. // A value of +1 means the close is equal to the high of the range. // A value of -1 means the close is equal to the low of the range. evolClose = ((Close-Close[1])/Close[1]) isDistributionDay = Volume > avgVolume and evolClose<-0.002 and closeLocationValue<0 // colors definition r=0 g=0 b=0 // 10 day pocket pivot bar : green bar if isPP10 then r=0 g=255 b=0 // distribution day bar : red bar elsif isDistributionDay then r = 206 g=83 b=86 // up volume day bar : light gray bar elsif isAnUpDay then r=192 g=192 b=192 // donw volume day bar : dark gray bar else r=130 g=130 b=130 endif // Dry volume : display down arrow in case of volume less than 45 % of the 50 days average volume avgVol45 = 0.55 * avgVolume if(Volume <= avgVol45) then drawtext("▾",barindex,avgVolume, dialog,bold,20)coloured("LightCoral") endif return Volume Coloured(r,g,b) style(histogram) AS "Enhanced Volume Pocket Pivot",avgVolume coloured(255, 127, 39) style(line) as "50 Days Average Volume" |
Share this
No information on this site is investment advice or a solicitation to buy or sell any financial instrument. Past performance is not indicative of future results. Trading may expose you to risk of loss greater than your deposits and is only suitable for experienced investors who have sufficient financial means to bear such risk.
ProRealTime ITF files and other attachments :PRC is also on YouTube, subscribe to our channel for exclusive content and tutorials


