HighLow Adaptive Momentum Cycle

HighLow Adaptive Momentum Cycle

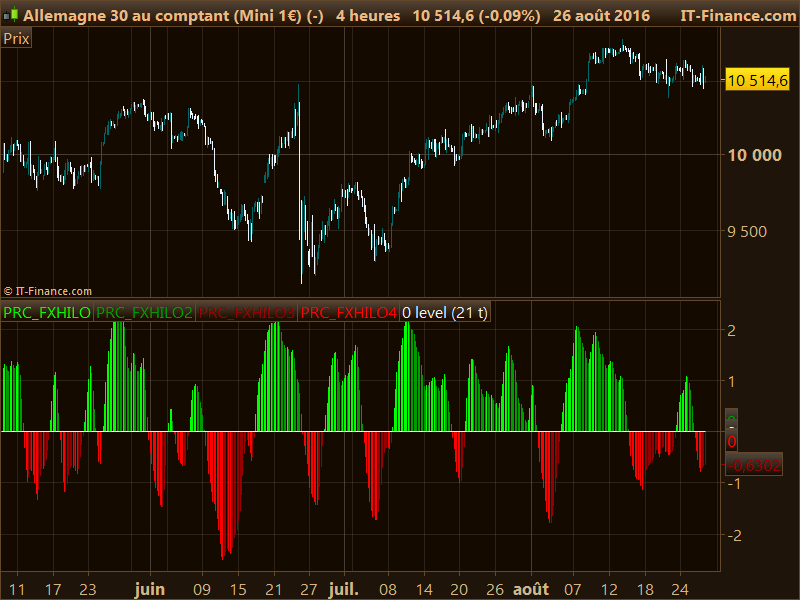
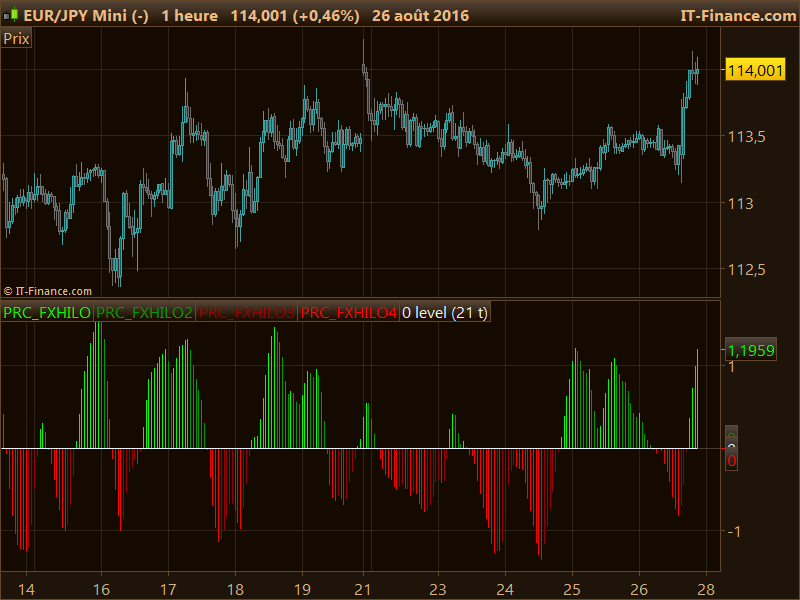
Here is a new oscillator made of a cycle calculation of the median price calculated from the highest high and lowest low of the last x periods.

An adaptive period formula can be activated to calculate the “best” period of the hi/lo channel because of market noises.

I added 4 different returned buffers to identify when the oscillator is increasing or declining above of below the 0 level which represent the bull/bear side of the market.


Share this

Risk disclosure:

No information on this site is investment advice or a solicitation to buy or sell any financial instrument. Past performance is not indicative of future results. Trading may expose you to risk of loss greater than your deposits and is only suitable for experienced investors who have sufficient financial means to bear such risk.

ProRealTime ITF files and other attachments : How to import ITF files into ProRealTime platform?

PRC is also on YouTube, subscribe to our channel for exclusive content and tutorials

  1. winnie37 • 08/28/2016 #

    bonsoir Nicolas,
    je réagis tardivement à cet indicateur 🙂 Ne serait-il pas particulièrement adapté dans le cadre de stratégies binaires, dans le sens de la tendance? A tester….

    • Nicolas • 08/28/2016 #

      Comme un nombre incalculable d’autres indicateurs codés deci delà, je compte sur d’autres pour les tester et en profiter. Si j’ai eu l’idée de faire cet indicateur à l’époque et de le poster ici, c’est qu’il m’a semblé assez signicatif pour être utilisé. Si tu as des exemples de sa bonne utilisation selon ta propre interprétation,  ça m’intéresse d’en discuter 🙂  

  2. NeraVeem • 08/28/2016 #

    Dear Nicolas,
    First of all, thank you for all your contributions, I always study them with great pleasure. I assume you are the creator of the prc-fxhilo indicator. As an indicator, this indicator is easy to invoke in other indicators. However, in the screening section this does not seem to be the case. Neither as a call function nor in case you use the code directly in a screen builder. Do I miss something or simply can not? Like to hear from you. Sincerely, Gerard

    • Nicolas • 08/28/2016 #

      It should not be a problem to use it in a stock screener, what is the problem exactly? Be aware that there are 4 different buffers, 2 for ascending and declining above 0 and the 2 others for when the oscillator is below 0.

    • NeraVeem • 08/28/2016 #

      Dear Nicolas, 
      thnx for your reply! In your answer you said: ‘It should not be a problem to use it in a stock screener’. I am afraid that the problem my ‘use direction’ is. In other words: I tried to use the indicator in a forex screener. The second possibility cause of the problem is maybe that I only use the minustwo and the plustwo lines. The other signals are ‘ignored’. Should that possible the problem? Kind regards, Gerard

    • Nicolas • 08/28/2016 #

      What condition are you trying to look for? When the oscillator is crossing the zero line?

  3. NeraVeem • 08/28/2016 #

    Dear Nicolas,
    ‘Reading’ the ‘output’ of the indicator, it seems to me that there are no ‘crossings’.  The plustwo finshed at the zero line in case of bearing direction, the minustwo also in case of bullish direction. That’s why I thought to create a screener where the one (for example: minustwo finished at zero line and the plustwo ‘take it over’. That simulates for me a ‘crossing’. Because in my opinion thre are no real crossings, I thought I would solve it by ‘greater than’ (in bullish case) or ‘less than’  ( in bearish case) operators. The remaining variables I thought would turn off with the ‘REM’ command or use the ‘ignored’ construction. De with the ‘Ignored’ command  fails and the option with the ‘REM’ gives no results in the screener.
    Please, see script below. 
    Adaptive = 1myPeriod = 14
    once f = 0once g = 0
    if barindex>myPeriod then
    //adaptive periodaveragePeriod = myPeriodif adaptive=1 and averagePeriod > 1 thenprice = medianpriceminPeriod = round(averagePeriod/2.0)maxPeriod = minPeriod*5.0endPeriod = round(maxPeriod)signal = Abs((price-stored[endPeriod]))noise = 0.00000000001
    for k=1 to endPeriod donoise=noise+Abs(price-stored[k])averagePeriod = round(((signal/noise)*(maxPeriod-minPeriod))+minPeriod)next
    endifstored=priceaverageperiod=max(averageperiod,2)myHigh = Highest[abs(averagePeriod)](high)myLow = Lowest[abs(averagePeriod)](Low)mean = (High + Low) / 2.0myVAR1 = 0.66 * ((mean – myLow) / (myHigh – myLow) – 0.5) + 0.67 * fmyVAR1 = Min(Max(myVAR1, -0.999), 0.999)fxhilo = Log((myVAR1 + 1.0) / (1 – myVAR1)) / 2.0 + g / 2.0 //main linef = myVAR1g = fxhiloif fxhilo>fxhilo[1] and fxhilo>0 thenREM plusone = fxhiloREM plustwo = 0REM minusone = 0minustwo = 0elsif fxhilo<fxhilo[1] and fxhilo>0 thenREM plusone = 0REM plustwo = fxhiloREM minusone = 0minustwo = 0elsif fxhilo>fxhilo[1] and fxhilo<0 thenREM plusone = 0REM plustwo = 0REM minusone = fxhilominustwo =0elsif fxhilo<fxhilo[1] and fxhilo<0 then REM plusone = 0REM plustwo = 0REM minusone = 0minustwo = fxhiloendifendif
    // Bullish Sign
    If MinusTwo < minusTwo[1] OR MinusTwo[1] < minusTwo[2]ThenCriteria = 110EndIf
    Screener [Criteria] (Criteria AS “MinusLow”)
    I’ve tried to upload a sceenprint as example, but that was refused by this text editor.
    So far my problem.
    Kind regards,
    Gerard

    • Nicolas • 08/28/2016 #

      Sorry, it has needed a lot more customisation of the indicator’s code to get a relevant screener. This code should work (worked for me on a daily timeframe for NASDAQ stocks for instance)
      // parameters
      myPeriod = 21
      Adaptive = 1 //boolean

      once f = 0
      once g = 0

      //adaptive period
      averagePeriod = myPeriod
      if adaptive=1 and averagePeriod > 1 then
      price = medianprice
      minPeriod = round(averagePeriod/2.0)
      maxPeriod = minPeriod*5.0
      endPeriod = round(maxPeriod)
      signal = Abs((price-stored[endPeriod]))
      noise = 0.00000000001
      mymaxbar = 254-maxPeriod
      endif

      if barindex>mymaxbar then

      if adaptive=1 and averagePeriod > 1 then
      for k=1 to endPeriod do
      noise=noise+Abs(price-stored[k])
      averagePeriod = round(((signal/noise)*(maxPeriod-minPeriod))+minPeriod)
      next

      endif
      stored=price
      averageperiod=max(averageperiod,2)
      myHigh = Highest[abs(averagePeriod)](high)
      myLow = Lowest[abs(averagePeriod)](Low)
      mean = (High + Low) / 2.0
      myVAR1 = 0.66 * ((mean - myLow) / (myHigh - myLow) - 0.5) + 0.67 * f
      myVAR1 = Min(Max(myVAR1, -0.999), 0.999)
      fxhilo = Log((myVAR1 + 1.0) / (1 - myVAR1)) / 2.0 + g / 2.0 //main line
      f = myVAR1
      g = fxhilo

      endif

      condition = g crosses over 0 or g crosses under 0

      screener[condition]
       

  4. NeraVeem • 08/28/2016 #

    Dear Nicolas,
    thnx a lot of your screener script. A quick test teaches that it works, also for Forex trading in smaller timeframes. Again, thnx !!!
     
    Gerard

  5. Vinks_o_7 • 08/28/2016 #

    hello
    Pour info, j’ai une erreur sur la version actuelle de PRT: un paramètre de type entier positif est attendu pour highest…

    • Nicolas • 08/28/2016 #

      As-tu bien enlevé les // devant les paramètres “myPeriod” et “Adaptive” ?

    • carlvan • 08/28/2016 #

      J’ai la même erreur. Pourtant ABS donne par définition un nombre positif

    • Nicolas • 08/28/2016 #

      Essayons de remplacer la ligne 27 par:
      averageperiod=max(round(averageperiod),2)

  6. Traste • 08/28/2016 #

    Hi!! this is a great indicador, which I regularly use on PRT. However, I’d love to have it on TradingView too, is there any chance it can be converted? Thanks!

    • Nicolas • 08/28/2016 #

      We don’t provide TV assistance on our website, to get private paid coding translation use the programming services: https://www.prorealcode.com/trading-programming-services/

    • Suzu Yuk • 08/28/2016 #

      Hello, I am still getting the same error even after removing the // in front of the “myPeriod” and “Adaptive” parameters….. Why?

avatar
Register or

Likes

avatar avatar avatar avatar avatar avatar avatar avatar avatar avatar
Related users ' posts
jebus89 Big thanks for sharing this :) Seems to work as expected, good stuff.
xpe74 Top visually, and very efficient. I would like to integrate it as a value in a small algo i...
Nicolas Sorry again, doing my best to fix this problem..
Gianluca Sorry but the 2° code that you posted have some problem it doesn't work
Leo I have to check
Alai-n I also have the same problem that I can not solve especially on LowVolume (Yellow) ... Sorry
Mert No need to apologise, my friend. It is great code. I hope you find a solution soon. Regards.
gabri I think it's because the lookback period changes at every new bar and that means that many c...
Vonasi Thanks for the compliments ALE. If you use any results from it in a strategy then please sha...
CKW this is Awesome tool. thanks Vonasi
Vonasi ....and thank you for the compliment CKW.
Reiner great work:-)
Vonasi Thanks Reiner. that is compliments indeed from the seasonality expert. I have a second vers...
Sagal Hi Vonasi, Can it be presented as a 1 year graph displaying a 5 year average or 10 year aver...
Vonasi I noticed a couple of typo errors in the code. The list of variables lines 4 to 11 should be...
Genotik Thank you for your important contribution this week which is much appreciated! Happy New Yea...
Vonasi No problem. I hope they are useful to someone. Happy and hopefully prosperous New Year to y...
DarioMazza Hi Vonasi, i have a question for you, the comand "pricetype" where did you found it in the ...
Vonasi PriceType is just a variable that I use. The value decides what type of price is used in the...
Vonasi I noticed a couple of typo errors in the code. The list of variables lines 4 to 11 should be...
Vonasi The indicator code can easily be adapted for use as a filter in strategies as well. For exam...
AVT Tested today in manual DAX trading (transcripted to MT and changed look into aka oszillator)...
Vonasi I think that short time frame charts will be too noisy for this indicator. One blue bar real...
Vonasi I forgot to mention in the description that Sunday pivot lines are ignored and Monday's pivo...
AVT Like that, simple and clear!
Vonasi Thanks AVT. I like simple - some people would say that I do simple very well! Sometimes you ...
Nicolas
7 years ago
Nicolas Oui. Pour changer la période, il faudra ajuster la variable MMperiod
macbartin plus la période est grande (en occurrence 20) plus l'indicateur est précis dans les changeme...
Hasardeur Hallo Nicolas, in John Ehlers book "cycle analytics for Traders" from 2013, Mr. Ehlers desc...
MaoRai54 Hi, first of all Happy New Year. Well, I've inserted your indicator in DAX 1h but I cann...
Vinks_o_7 Hi Mao Happy New Year ! This is just an improved RSI where you plot a standard price momen...
SpreadBetMH Hi there, I have V11.1. I get the Indicator but no Arrows on the price. Kind Regards...
Alai-n Ciao Francesco, sei ancora in giro?
Metodi97 This indicator is great but can someone create strategy based on the same indicator it will ...
cervantes2 Buenas tardes y gracias por este magnifico indicador. Queria saber si tienes un proscreener ...
cervantes2 Que busque los valores que la linea verde acaba de cruzar al alza o a la baja
AngelPujalt Tenéis algún screener de este indicador?
Giuseppe68 ciao, ho provato l'indicatore e mi sembra interessante, ma in fase di backtest non riesco ad...
poldoposta veramente bello.....complimenti
Nicolas Formule de l'indicateur Momentum: Le Momentum se calcule avec une simple soustraction pour ...
Roberto1 Hi, can this code be converted for the Nanotrader Platform or for the MT4 Platform?
Nicolas This website is dedicated for PRT programming, but you can still ask for private coding with...
Nicolas
7 years ago
TradeNavigator RSI
TradeNavigator RSI
10
Indicators
Nicolas Tutte le impostazioni che hanno la parola "period" sono quelle dedicate ai periodi di cambio...
GianfrancoCeck Le chiedo una ultima cosa, ossia se è possibile personalizzare l'indicatore con una scritta ...
Nicolas Spiacente che non sia possibile, le coordinate grafiche non sono in pixel ma nel prezzo e ne...
ALE
7 years ago
settival CIAO ALE CREDO DI AVER SETTATO PER BENINO LO SCALPING INDICATOR MA NON VISUALIZZO I SEGNALI ...
graff.laetitia Hello, I'm sorry to bother you, I'm new to trading, I managed to download the indicator but ...
Alby118 i can get it to work? dax 1 min. upload indicator on the4 chart. thank you
swapping merci gabri, on va le mettre à l'essai ;)
Nicolas
7 years ago
Trinity Impulse
Trinity Impulse
5
Indicators
ribou ah d'accord merci beaucoup
domenico nlevel1 non modifica la curva al variare del suo valore
tiger_man_no1 Very nice ; what is the best period input date for DAILY CHART ?

Top