First hour of trading average high and low

First hour of trading average high and low

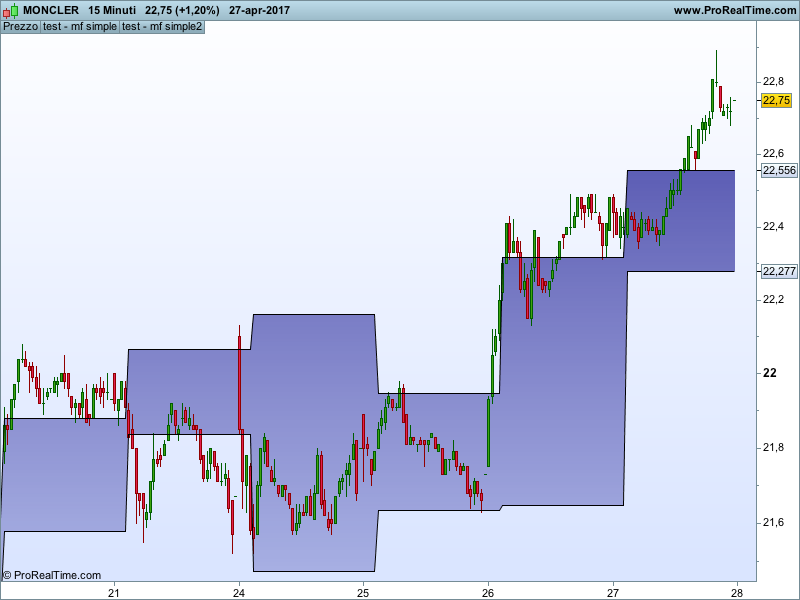
This indicator was needed by Roman.

The upper line shows the highest of the first hour plus the average for the past n days of the difference between the first-hour-highest and the daily open.

the lower line shows the lowest of the first hour minus the average for the past n days of the difference between the first-hour-lowest and the daily open.

I hope someone else might use this code.

Blue skies

Share this

Risk disclosure:

No information on this site is investment advice or a solicitation to buy or sell any financial instrument. Past performance is not indicative of future results. Trading may expose you to risk of loss greater than your deposits and is only suitable for experienced investors who have sufficient financial means to bear such risk.

ProRealTime ITF files and other attachments : How to import ITF files into ProRealTime platform?

PRC is also on YouTube, subscribe to our channel for exclusive content and tutorials

  1. Maz • 04/28/2017 #

    Hi, I quite like this idea. I just wanted to suggest some code alterations:
    // --------------------------------
    // once period = 20
    // once gmtOffset = 000000 // 010000 for EU just an idea
    once startTime = 080000 //+gmtOffset ??
    // --------------------------------

    once endTime = startTime+010000
    // to avoid nasty spike on the graph
    once up = undefined
    once down = undefined
    once super = undefined
    once infer = undefined

    //computation timeframe in use and intraday number of bars - intrab
    if intradayBarIndex = 0 then
    time1=opentime
    elsif intradayBarIndex = 1 then
    time2=opentime
    // only needs to be done once a day no?
    deltatime=(time2-time1)/100
    intrab=round(522/deltatime)
    endif
    //deltatime=(time2-time1)/100
    //intrab=round(522/deltatime)

    //computation max and min in the first hour - super e infer
    if (time>=startTime) and (time<=endTime) then
    super = dopen(0)
    infer = dopen(0)
    //if high>super then
    //super=high
    //endif
    super = max(high, super)
    //if low<infer then
    //infer=low
    //endif
    infer = min(low, infer)
    endif
    //else
    //super = super // ??? why?
    //infer = infer // ??? why?
    //endif

    //computation average (super-initialopen) and (initialopen-infer)
    if (time = endTime) then
    sommadeltasuper=0
    sommadeltainfer=0
    for i=0 to (period) do
    j=1+round(i*intrab)
    sommadeltasuper = sommadeltasuper+abs(super[j]-dopen(i))
    sommadeltainfer = sommadeltainfer+abs(dopen(i)-infer[j])
    next
    deltasuper = sommadeltasuper/period
    deltainfer = sommadeltainfer/period
    //endif
    //if time>endTime then
    elsif time>endTime then
    up=super+deltasuper
    down=infer-deltainfer
    else
    up=up
    down=down
    endif

    return up,down


  2. gabri • 04/28/2017 #

    Maz,
    excellent corrections, thanks a lot
    Gabri

  3. Francesco78 • 04/28/2017 #

    Thank you, what is the rational? breakout outside the rectangle?
    Regards
    Francesco 

  4. gabri • 04/28/2017 #

    Roman made the strategy, I made the code and Maze made it bulltproof. You can use it I believe in many ways. A London breakout might be one of them for example.
     

  5. Roman • 04/28/2017 #

    Francesco78
    here is the strategy:
    https://www.prorealcode.com/topic/highlowopen-prices-for-specific-timeframes/

avatar
Register or

Likes

avatar avatar avatar avatar avatar
Related users ' posts
Dest
3 years ago
DIDI Index
DIDI Index
0
Indicators
SnorreDK Works extremely well - How? How do u implement this in a startegy? Breakoutstrategy?
Keyeming Thanks, but yes same question as above, some explanations on how to read it would be appreci...
Bateson Bonjour. Merci beaucoup ! J'ai installé l'indicateur sur PRT 11 mais pour des raisons qui ...
khashayar
3 years ago
ichimoku soft
ichimoku soft
2
Indicators
DELBERT Bonjour , je voudrais savoir si votre indicateur peut être installé sur PRT V.10.3 ou s'il e...
khashayar Hi I wrote for version 11. But I think it works for version 10.3 as well. Thanks
Madrosat how do you use carnazzi filter in a strategy : smoothing , stop ,tendance
Bruno Carnazzi I have completely revised the mathematical foundations of this tool and offer you the finali...
larouedegann
3 years ago
TWAP
TWAP
0
Indicators
Sever
3 years ago
Sever
3 years ago
Bruno Carnazzi Il me semble que la fonction "floor" n'est disponible qu'avec PRT11, à vérifier
DELBERT Bonjour , merci pour votre réponse , je m'excuse je suis avec PRT v10.3 donc c'est indicateu...
Nicolas c'est juste, c'est une instruction très récente.
Stenozar Hi Sever, how can I visualize the coloured areas?
Sever Hi Stenozar, You need to add the color zones yourself , just go to Add Color Zone To set ...
CederTrader Hi Denis, does this indicator add to the chart as panel, or on the candles. Thanks
Nicolas Add it on the price chart as described in this video: https://www.prorealcode.com/blog/video...
Denis Hello Nicolas and Ceder Trader, Sorry, I only just saw your replies. The indicator is alre...
arrey Hello all, I was really interested to play around this indicator but I received an error ...
maxlys Bonjour, Merci pour cet indicateur. Pou rma part fonctionne bien sur PRT 11. Comment le modi...
crolakstrading not sure why its not working at all!
YvesRobert Hi smp, how should I configure this indicator because everything is at zero -> High, Clos...
smp Hi, this is an end of day pivots indicator, so you need to find the end of day pivot info; t...
YvesRobert Thank you smp.
smp I also have an End Of Day (EOD) cash pivot indicator for use on cash markets; this indicator...

Top