Perfect Trend Line 2

v10.3
Perfect Trend Line 2

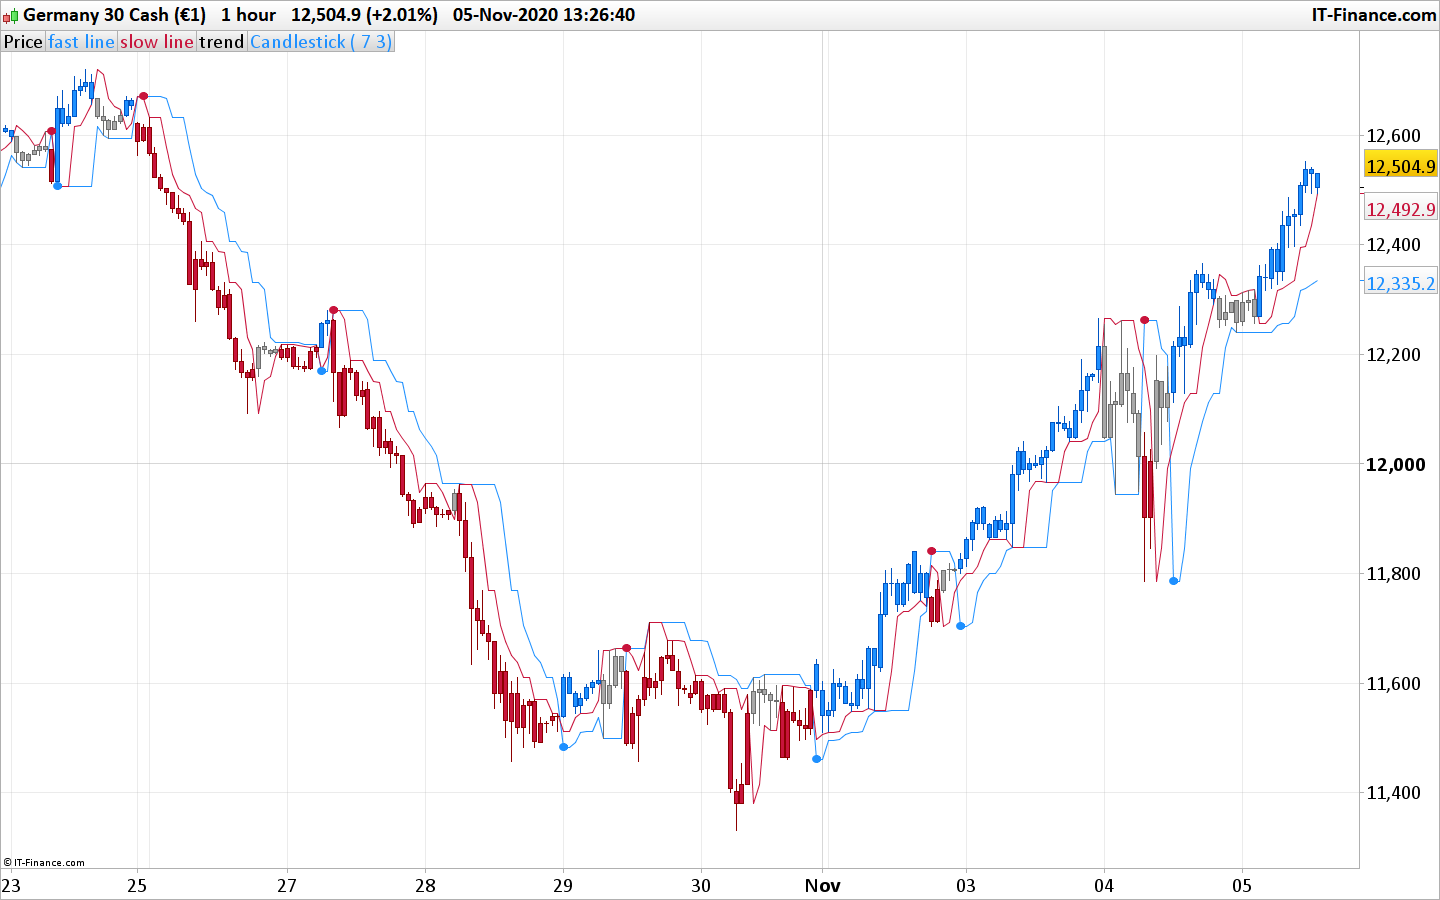
This is a variation of a well known perfect trend line indicator (the initial version can be found here: Perfect Trend Line

This version is adding a sort of signals filtering which helps in cleaning up some false signals that are there in the original version.

Usage :

  • You can use the arrows (dots) as early signals
  • You can use the appearance of the color candle as signal for entry or re-entry


Share this

Risk disclosure:

No information on this site is investment advice or a solicitation to buy or sell any financial instrument. Past performance is not indicative of future results. Trading may expose you to risk of loss greater than your deposits and is only suitable for experienced investors who have sufficient financial means to bear such risk.

ProRealTime ITF files and other attachments : How to import ITF files into ProRealTime platform?

PRC is also on YouTube, subscribe to our channel for exclusive content and tutorials

  1. w • 11/05/2020 #

    HI NICOLAS, HOW CAN I CONNECT WOTH YOU, BECAUSE I NEED HELP WITH A NEW SIGNAL TO PROGRAMATE FOR A PRO REAL TIME TKS

    • Nicolas • 11/05/2020 #

      For private paid assistance you can contact me on this page: https://www.prorealcode.com/trading-programming-services/
      For any other coding query, you can use our free public forums.

  2. Yantra • 11/05/2020 #

    I have v10.3 via IG and usually, all your indicators display correctly but this one is just very squashed in a narrow horizontal line, dots, candlesticks, and all. Adjusting the optimised scale button and Zoom in/out buttons does little to affect it. Any suggestions to cure that? Thank you.

    • Nicolas • 11/05/2020 #

      in the price settings window, check the box for “Vertical autoscaling: use price only”. Or remove , trend as “trend” in the last line of the code.

  3. Yantra • 11/05/2020 #

    That did it! Nicolas, what a modest genius you are! Thank you for your work and all you offer on this site.

  4. Manu L • 11/05/2020 #

    Bonjour Nicolas,
    est ce que ton indicateur est utilisable sur toutes les UT ? Et sur la dernière version de PRT ?

    Merci

    • Nicolas • 11/05/2020 #

      Oui, il peut être appliqué sur toutes les unités de temps et fonctionne sur prorealtime v11.

  5. Manu L • 11/05/2020 #

    merci pour ce retour et je tiens a vous remercier sur la qualité de vos indicateurs.
    Cependant, pourquoi quand je le combine avec votre indicateur “Top Bottom indicator” j’observe un décalage et je ne suis pas sur les même tops entre les 2 indicateurs ?

  6. Canis Majoris • 11/05/2020 #

    bonjour nicolas,

    cet indicaeur marche une seule fois lors du chargement la premiere fois dans le graphes , si par exemple il es chargé en 15 min , si je passe à l’UT 5 min , il devient plat , et n’est plus visible

    • Nicolas • 11/05/2020 #

      Ajoutez: “if barindex>slowlength” à la ligne 17, sans les guillemets
      et “endif” à la ligne 80.

    • oxy75 • 11/05/2020 #

      idem, même problème, bizarre ^^

  7. Canis Majoris • 11/05/2020 #

    j’ai ajouté la condition , j’ai toujours le meme probléme , j’ai pourtant ,prt v11 !
    maintenant il ne s’affiche plus du tout dans n’importer quelle UT

    • Nicolas • 11/05/2020 #

      Aucun problème de mon côté, quel instrument en particulier? Combien de données affichées sur le graphique? (unités / barres / chandeliers).

  8. Canis Majoris • 11/05/2020 #

    micro gold future/micro s&p/micro DJ sur UT 1h-15′-5′ ,j’utilise un affichage 200 unité – avec des bougies style (Hollow candle)

    • Nicolas • 11/05/2020 #

      Aucun problème pour ma part avec les settings par défaut.

  9. Canis Majoris • 11/05/2020 #

    étrange ! en tout cas merci , rien qu’en l’employant seul il donne de bons résultats. surtout avec la nouvelle fonction de filtre

  10. Nick FX Junkie • 11/05/2020 #

    Hi Nicolas, firstly… amazing indicator THANK YOU! Question, is there anyway to change the red and blue dots to larger arrows? Would you be able to post the code to change this? Thanks in advance. Nick.

    • Nicolas • 11/05/2020 #

      bigger dots, replace 10 by a value like 25, at line 68.

    • Nick FX Junkie • 11/05/2020 #

      Legend! Much appreciated Thank You…

  11. superprof • 11/05/2020 #

    Bonjour Nicolas
    je suis débutant en trading
    1) les bougies grises, c’est quoi la signification ?stp
    2) pour fermer ma position , je dois toujours travailler avec support et résistance ( comment tu f pour savoir a quelle moment tu coupe ton Trade: stop loss??)
    Merci

  12. oxy75 • 11/05/2020 #

    Un grand Merci pour ce travail !

  13. karimprof • 11/05/2020 #

    bonjour
    que représente les bougies grises

    • Nicolas • 11/05/2020 #

      ce sont les bougies situées dessous/dessus la ligne rouge, selon le sens de la tendance (pullback).

  14. Lolo Obernai • 11/05/2020 #

    Merci Nicolas pour cet indicateur, j’ai rencontré le même souci de graph qui s’aplatissait après le changement d’UT, j’ai résolu le souci en rendant invisible la ‘trend’ dans l’indicateur, je vais maintenant pouvoir tester tout ca, encore un grand merci Amicalement Laurent

  15. Manu L • 11/05/2020 #

    Nicolas, existe-t-il un screnner pour detecter automatiquement les signaux d’achat ou possible de travailler sur cet indicateur pour le transformer ?
    merci

    • Nicolas • 11/05/2020 #

      Faire un CALL et utiliser la dernière variable “trend” comme signal, la condition serait du type: condition=trendtrend[1]

  16. Manu L • 11/05/2020 #

    Et ca donne quoi concretement ? 🙂

  17. marouaneayad • 11/05/2020 #

    Merci Nicolas pour le code, je l’ai retravaillé et j’ai optimisé le code pour le même résultat y’a toute une partie ou tu calcules les plus haut et les plus bas qui est redondée, c’est fait automatiquement par PRT dans ton init des variables :

    // ===================TrendLine Indicateur====================
    // Variables du Trend
    SlowLength = 7 // Slow length
    FastLength = 3 // Fast length

    // Calcul des plus Haut et des plus bas sur les 2 périodes
    fasthigh = Highest[FastLength](high)
    fastlow = Lowest[FastLength](low)
    slowhigh = Highest[SlowLength](high)
    slowlow = Lowest[SlowLength](low)

    if close > fastln[1] then
    fastln=fastlow
    else
    fastln=fasthigh
    endif
    if close > slowln[1] then
    slowln=slowlow
    else
    slowln=slowhigh
    endif

    once trend=-1
    if close < fastln and close fastln and close > slowln then
    trend=0
    endif

    if trendtrend[1] then
    if trend=0 then
    r=30
    g=144
    b=255
    else
    r=200
    g=20
    b=60
    endif
    drawtext(“●”,barindex,slowln,Dialog,Bold,10) coloured(r,g,b)
    endif

    drawcandle(open,high,low,close) coloured(168,168,168)
    if trend=0 then
    if close>fastln then
    drawcandle(open,high,low,close) coloured(30,144,255)
    endif
    elsif trend=1 then
    if close<fastln then
    drawcandle(open,high,low,close) coloured(200,20,60)
    endif
    endif

    return fastln coloured(200,20,60) as "fast line", slowln coloured(30,144,255) as "slow line", trend as "trend"

  18. MauroPro • 11/05/2020 #

    Hi, someone could explain how the program knows what is the term: “slowln” (in line 39), because the term is not defined (in line 18, for example, the expression “slowhigh” instead is clear because refer to: Highest[FastLength](high) .
    Thanks

  19. MauroPro • 11/05/2020 #

    To be more precise, what I don’t understand is how it is possible that the variables: “slowln” and “fastln” have never been assigned. Thanks

    • Nicolas • 11/05/2020 #

      these variables are assigned between lines 39 to 48

  20. MauroPro • 11/05/2020 #

    Hi Nicolas, could you recommend me some mid-high level programming manuals for Prt or similar language ? (english-french-italian-german) Thanks

  21. GPTrader64 • 11/05/2020 #

    Bonjour Nicolas,
    Un grand merci pour cet Indicateur, et de partager tout ce travail.
    J’ai pu affiner mes entrées et sorties de positions avec une meilleure précision.
    Bravo

  22. groen200 • 11/05/2020 #

    Have you please a backtest for this indicator “perfecttrenline-2”

  23. Manu L. • 11/05/2020 #

    Bonjour Nicolas,
    si je souhaite avoir un screener me signalant que les actions ayant un point bleu, quel pourrait etre celui-ci ?

    • Nicolas • 11/05/2020 #

      Détecter un croisement entre les lignes bleu et rouge, soit les 2 variables retournées par l’indicateur. Facile avec la création assistée.

  24. Manu L. • 11/05/2020 #

    J’ai creer un screnner avec la easy programmation avec FL = SL le tout avec periode en cours mais le screenner me sort que des anciens !?

  25. Manu L. • 11/05/2020 #

    J’ai bien tente de creer le screnner

    indicator1, ignored, ignored, ignored = CALL “PRC_PerfectTrendLine 2″[7, 3]
    ignored, indicator2, ignored, ignored = CALL “PRC_PerfectTrendLine 2″[7, 3]
    c1 = (indicator1 CROSSES UNDER indicator2)

    SCREENER[c1] ((close/DClose(1)-1)*100 AS “% Veille”)

    mais j’ai un message d’erreur “retoune 3 valeurs mais le code en a besoon de4 ”
    Un coup de main 🙂

  26. Hans63 • 11/05/2020 #

    This is one of the best indicator ever made
    Congrats!

  27. Manu L. • 11/05/2020 #

    Bonjour Nicolas,
    je m’intéresse de plus en plus à ton indicateur car les signaux d’entrée tiennent la route et j’ai réussi en le passer en screnner 🙂
    Le pb est que je l’utilise sur les périodes journalier et hebdo mais impossible de l’uliser en mensuel car PRT ne propose pas cet UT.

    Quel serait la solution car l’idée serait de screnner sur ces trois périodes et d’ensuite compiler sur excel et trouver toutes les actions qui ont le point bleu en mensuel, hebdo, journalier.

    Merci pou ton aide précieuse

    • Nicolas • 11/05/2020 #

      multiplier les périodes ? Il y a 4 semaines dans 1 mois, donc dans le TF hebdo, screener avec la période * 4.

  28. Manu L. • 11/05/2020 #

    Le pb est que je screen en journalier et hebdo directement dans la sélection mais pour screener en mensuel, à quel endroit faut-il que j’ajoute le *4 ? Voici mon prog

    // — settings
    SlowLength = 7 // Slow length
    SlowPipDisplace = 0 // Slow pip displace
    FastLength = 3 // Fast length
    FastPipDisplace = 0 // Fast pip displace
    c1 = volume

    // — end of settings

    thigh1 = Highest[SlowLength](high)+ SlowPipDisplace*pointsize
    tlow1 = Lowest[SlowLength](low)- SlowPipDisplace*pointsize
    thigh2 = Highest[FastLength](high)+ FastPipDisplace*pointsize
    tlow2 = Lowest[FastLength](low)- FastPipDisplace*pointsize

    if barindex>2 then
    if Close >line1[1] then
    line1 = tlow1
    else
    line1 = thigh1
    endif
    if Close>line2[1] then
    line2 = tlow2
    else
    line2 = thigh2
    endif
    endif

    if (Close[0]<line1[0] and Close[0]line1[0] and Close[0]>line2[0]) then
    trend = -1
    endif
    if (line1[0]>line2[0] or trend[0] = 1) then
    trena = 1
    endif
    if (line1[0]5000]

    • Nicolas • 11/05/2020 #

      il s’agit des périodes de calcul SlowLength et FastLength (7*4 et 3*4)

  29. Manu L. • 11/05/2020 #

    merci Nicolas
    En revanche je ne comprends pas : en période hebdo et en appliquant le *4 avec Actions France, il me sort les actions AF, AC, VK, CDA, GECP mais en naviguant sur d’autres actions je tombe sur ALHYG et FP avec point bleu alors que mon screener ne les a pas détecter !?

    // — settings
    SlowLength = 7*4 // Slow length
    SlowPipDisplace = 0 // Slow pip displace
    FastLength = 3*4 // Fast length
    FastPipDisplace = 0 // Fast pip displace
    c1 = volume

    // — end of settings

    thigh1 = Highest[SlowLength](high)+ SlowPipDisplace*pointsize
    tlow1 = Lowest[SlowLength](low)- SlowPipDisplace*pointsize
    thigh2 = Highest[FastLength](high)+ FastPipDisplace*pointsize
    tlow2 = Lowest[FastLength](low)- FastPipDisplace*pointsize

    if barindex>2 then
    if Close >line1[1] then
    line1 = tlow1
    else
    line1 = thigh1
    endif
    if Close>line2[1] then
    line2 = tlow2
    else
    line2 = thigh2
    endif
    endif

    if (Close[0]<line1[0] and Close[0]line1[0] and Close[0]>line2[0]) then
    trend = -1
    endif
    if (line1[0]>line2[0] or trend[0] = 1) then
    trena = 1
    endif
    if (line1[0]5000]

    • Nicolas • 11/05/2020 #

      c’est plus une méthode de contournement que l’utilisation réelle du timeframe monthly.

  30. Manu L. • 11/05/2020 #

    Mais est-il possible de programmer en TF monthly alors que PRT propose max weekly ?

    • Nicolas • 11/05/2020 #

      c’est très complexe dans ProScreener et différent pour chaque code, peut être dans sa prochaine version quand il intégrera les variables en tableaux.

  31. maxlys • 11/05/2020 #

    Bonjour Manu L, merci pur le code de ton screener. pour ma part j’ai 2 erreurs qui ressortent
    1ere erreur sur la ligne:
    if (Close[0]line2[0]) then
    il manque un paramètre entre Close[0]line1[0]

    2eme erreur :
    dernier ligne
    if (line1[0]5000], ici il manque pas du code pour la fin du screener ? peux tu m’indiquer quelles sont les erreurs a corriger ou bien reposter on code complet, ça serait otp . merci toi.

    • Manu L. • 11/05/2020 #

      // — settings
      SlowLength = 7*4 // Slow length
      SlowPipDisplace = 0 // Slow pip displace
      FastLength = 3*4 // Fast length
      FastPipDisplace = 0 // Fast pip displace
      c1 = volume

      // — end of settings

      thigh1 = Highest[SlowLength](high)+ SlowPipDisplace*pointsize
      tlow1 = Lowest[SlowLength](low)- SlowPipDisplace*pointsize
      thigh2 = Highest[FastLength](high)+ FastPipDisplace*pointsize
      tlow2 = Lowest[FastLength](low)- FastPipDisplace*pointsize

      if barindex>2 then
      if Close >line1[1] then
      line1 = tlow1
      else
      line1 = thigh1
      endif
      if Close>line2[1] then
      line2 = tlow2
      else
      line2 = thigh2
      endif
      endif

      if (Close[0]<line1[0] and Close[0]<line2[0]) then
      trend = 1
      endif
      if (Close[0]>line1[0] and Close[0]>line2[0]) then
      trend = -1
      endif
      if (line1[0]>line2[0] or trend[0] = 1) then
      trena = 1
      endif
      if (line1[0]<line2[0] or trend[0] = -1) then
      trena = -1
      endif

      screener[trena=-1 and trena[1]=1 and c1>5000]

  32. wtf_trading • 11/05/2020 #

    Hi Nicolas,
    I am new here, what language is the above code in, I want to try implementation in python?
    Thanks

  33. Manu L. • 11/05/2020 #

    Bonjour Nicolas,
    je te contacte car j’avais un indicateur PRC_FractalsTrendLine.itf mais celui beug et impossible de retrouver le lien du post pour récupérer la source.

    J’ai bien les diagonales qui s’affichent mais plus les paliers de S/R. serais-tu me retrouver celui-ci.

    En te remerciant

    • Nicolas • 11/05/2020 #

      C’est dans ce sujet: https://www.prorealcode.com/topic/trendline-une-approche-du-trading/
      Merci de poser la question dans celui-ci.

  34. Manu L. • 11/05/2020 #

    defparam drawonlastbaronly = true

    //fractals
    cp = lookback
    if high[cp] >= highest[(cp)*2+1](high) then
    LLH = 1
    else
    LLH = 0
    endif

    if low[cp] <= lowest[(cp)*2+1](low) then
    LLL = -1
    else
    LLL = 0
    endif

    if LLH = 1 then
    oldLTOPy = LTOPy[1]
    oldLTOPx = LTOPx[1]
    LTOPy = high[cp]
    LTOPx = barindex[cp]
    endif

    if LLL = -1 then
    oldLBOTy = LBOTy[1]
    oldLBOTx = LBOTx[1]
    LBOTy = low[cp]
    LBOTx = barindex[cp]
    endif

    //trend line
    DRAWLINE(oldLTOPx,oldLTOPy,LTOPx,LTOPy)coloured(112,169,161)
    DRAWLINE(oldLBOTx,oldLBOTy,LBOTx,LBOTy)coloured(211,78,36)

    //support/resistance
    if showSR then
    DRAWHLINE(LTOPy) COLOURED(207,215,199,100)
    DRAWHLINE(LBOTy) COLOURED(207,215,199,100)
    endif

    RETURN

  35. Manu L. • 11/05/2020 #

    C’est cette partie qui ne s’affiche plus

    //support/resistance
    if showSR then
    DRAWHLINE(LTOPy) COLOURED(207,215,199,100)
    DRAWHLINE(LBOTy) COLOURED(207,215,199,100)
    endif

  36. Pensera • 11/05/2020 #

    Bonjour Nicolas,
    comment est-il possible de backtester cet indicateur?
    cela fait une erreur “retourne 3 valeurs mais votre code en a besoin de 4” désolé cela fait plus de 5 ans que je n’ai pas programmé sur PRT…je vais profiter des vacances pour m’y remettre
    D’avance merci pour votre réponse
    Et merci et bravo pour la qualité des indicateurs que vous postez !

    • Nicolas • 11/05/2020 #

      Oui bien sûr, il doit y avoir pas mal de sujets dans le forum à ce propos.

  37. simmerseb • 259 days ago #

    Bonjour, merci beaucoup pour cet indicateur je le trouve très clair et pertinent.

avatar
Register or

Likes

avatar avatar avatar avatar avatar avatar avatar avatar avatar avatar avatar avatar avatar avatar avatar avatar

+36 more likes

Related users ' posts
CavalierDeCesDames Bonjour Nicolas, Thanks for your use full job. I tried this indicator on a shorter timefram...
Nicolas You are welcome. I'm glad you like it.
Bolbo It does not appear over the price indicator on V11. Thanks in advance.
bearbull As per PhilipSchultz question above, has anybody managed to add code for when it turns blue,...
Ybr35 Bonjour Nicolas, lorsque je lance l'indicateur, il m'est indiqué que je dois définir les var...
Nicolas L'idéal est de télécharger le fichier itf joint sur cette page et de l'importer dans la plat...
Nicolas Merci dans ce cas d'ouvrir un sujet dans le forum ProScreener svp.
Andrea Hi Nicolas, thx for your code. Please i need your help to understand this part of your code:...
Nicolas the MA200 is ascending since 20 periods.
Regan2020 Hi, has anybody update the above code to enable on a 15m or 5m TF?
gigi64 ik heb de code op mijn pro realtime gezet , en bij indicator staat hij erbij maar komt niet ...
gigi64 I have put the code on my pro realtime, and it is on the indicator, but it does not appear o...
supertiti Thanks you so much Lucassen
dreif123 hi, copied the above code, not working on 10.3 the system says "return can only be used at ...
LUCASSEN Hallo , i have no problem , and i have the same versie 10.3, maybe you can ask Nicolas, tha...
Nicolas Rien, il faut l'appliquer sur la charte. Soit le mettre sur le graphique du prix, à l'aide d...
signorini Merci pour votre réponse. Je l'applique sur la charte, j'utilise la petite clé pour effacer ...
signorini Je vous remercie, Nicolas. C'est fixé. Très bon week-end.
Krallenmann Hallo Nicolas, kannst du mir die Regeln für den Halftrend Indikator sagen? Aus dem Code kann...
davefransman Dear Nicolas, i want set a alert on the "HalfTrend "custom moving average" met Heikin Ashi w...
Nicolas Please post the question in a new forum topic, that would need custom coding I believe.
Lyam Pareil ne marche pas dommage
ahmedbouaziz89 Bonjour, quand j'ajoute le code ou le fichier dans l'outils screeners de Prorealtime je ne v...
tyvix Bonjour le code marche bien c est juste qu'il n y a pas d opportunité au moment ou vous le...
verdi55 Is there such a thing as a free lunch ?
maceng Thanks Nicolas for this great work! I would like to understand the math behind it in order t...
Nicolas Sorry I have no time to provide assistance for python programmers. Have a good day.
Maz Hi all, firstly happy to know that this is helping you. I look into updating it for PRT11 wh...
Nicolas just use 3 times a linear regression channel code you will find in the library.
leederbyshire Here's the link to alternative linear regression channel indicator Nicolas is referring to t...
Wing Yes, investigate as much as you want. For more insight, you can view the linet1, linet2 etc....
CKW Hi Wing, Thanks for your sharing. I am still trying to breakdown & understand your code...
Wing Hello CKW. No, the parameter, 7 in this case, is used when calling the RSI indicator to ide...
Nicolas Je vais faire l'indicateur et expliquer comment en même temps dans un sujet de forum. Plus s...
gregus merci nicolas toute ma gratitude est pour toi sa sera bien pratique car je pense ne pas etre...
Nicolas Ok merci donc d'ouvrir un sujet spécifique pour cette demande donc :) 
algotrader This indicator looks coolBut on attempt to use it for a strategy dev'I get an error.."The in...
dajvop @algotrader if you at the bottom of the code add: RETURN Buffer1 as "up", Buffer2 as "down",...
Bateson Si cela peut servir, l'indicateur Sadukey a été créé en utilisant un générateur de filtre ap...
Nicolas Thanks for contributing to the "ichimoku section" of the prorealtime code library Don't he...
sourberry Thank you , this is a great indicator works beautifully. Could you kindly modify to scr...
pp_playaflamenca Excuse me,... reading your code about spanB: [ SenkouSpanBFutureW = (Highest[SenkouSpanPerio...
Guibourse Hi ! I am asking once again for your help : would it be possible to use the ATR as a "take p...
Tradingrob Many thanks for the indicator, however if the price is below the indicator, then the indicat...
aldtrading Merci pour ton travail ! J'ai de bons résultats en utilisant cet indicateur
Nicolas
9 years ago
ALMA MACD
ALMA MACD
7
Indicators
Arnaud HALVICK Great indicator, thank you!
JMat45 Hi Nicolas, just reviewing this indicator and noticed that you have double assigned the vari...
Nicolas That would not make any difference because the code is read from top to bottom.
Mansoor What does COI stand for?
MikeGC Hi Mansoor, COI is the abbreviation for the Coppock indicator.
nonetheless Anyone interested in this strategy please see forum topic: https://www.prorealcode.com/topic...
MikeGC I don't know if you have used the variables a and b to optimise the parameters for the Super...
gianpiero75 I have not optimized, I multiplied the parameters for 6 (5,8), to use them on the 4  hoursTF...
bertrandpinoy bonjour Mike j utilise TrendChaser V2.0 et quand il prend position cela ne programme pas le ...
zilliq The reasons why I think it's time consuming and we loose time to try to do backests and Auto...
filiprb Hello Zilliq, You don't need a system to produce a walk forward test. You can easily create...
Philip Raphael It is incredible! Thanks for sharing, Doctrading!
eisi If i switch between different Markets, the Backgroundcolour will appear where it should not...
datageek How can I get alerts on colour change?
NAMBO40 Hello, I would like to add a 25 period SMA moving average. It's possible?

Top