







Quadratic regression

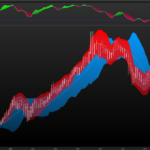
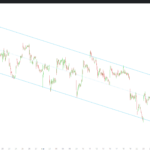
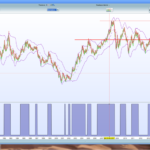
A quadratic regression is the process of finding the equation of the parabola that best fits a set of data. Period of the study can be modified with the “length” setting (default=100).
Converted from a tradingview code.
//PRC_Quadratic Regression | indicator
//22.08.2018
//Nicolas @ www.prorealcode.com
//Sharing ProRealTime knowledge

// --- settings
length = 100
// --- end of settings

y = close
x1 = barindex
x2 = square(x1)

S11 = summation[length](x2) - square(summation[length](x1))/length
S12 = summation[length](x1*x2) - (summation[length](x1) * summation[length](x2))/length
S22 = summation[length](square(x2)) - square(summation[length](x2))/length
Sy1 = summation[length](y*x1) - (summation[length](y)*summation[length](x1))/length
Sy2 = summation[length](y*x2) - (summation[length](y)*summation[length](x2))/length

max1 = average[length](x1)
max2 = average[length](x2)
may = average[length](y)
b2 = ((Sy1 * S22) - (Sy2*S12))/(S22*S11 - square(S12))
b3 = ((Sy2 * S11) - (Sy1 * S12))/(S22 * S11 - square(S12))
b1 = may - b2*max1 - b3*max2
qr = b1 + b2*x1 + b3*x2

return qr
Comments
You must be logged in to post a comment.

Dear Nicolas, I believe in the high potential of quadratic regression for an automated system. Therefore, I would like to understand in detail the principles how you have coded the algo. All the mathematical derivations I found, look somehow different, e.g. this one: https://www.azdhs.gov/documents/preparedness/state-laboratory/lab-licensure-certification/technical-resources/calibration-training/12-quadratic-least-squares-regression-calib.pdf Could you give me some more detailed information, please? Another question: Does this summation command: S11 = summation[length](x2) - square(summation[length](x1))/length, mean, that this line is like a loop which is processed times every 5 minutes if the period is M5? Thanks and kind regards, Michael

Nicolas, This regression delivers damn good results, especially for trends ! I'm wondering what degree of Polynomial Regression is used, and frankly, I can't recognize any polynomial resolution from your code. Do you have any background and formula that helped you in building that piece ? Thanks, Et toutes mes félicitations pour ce site que tu gères de main de maître ! Ca doit représenter du temps et bcp d'expertise ... Saches que ça aide beaucoup de monde, à commencer par moi-même. Stephan