







Reversal signal ThreeLineBreak
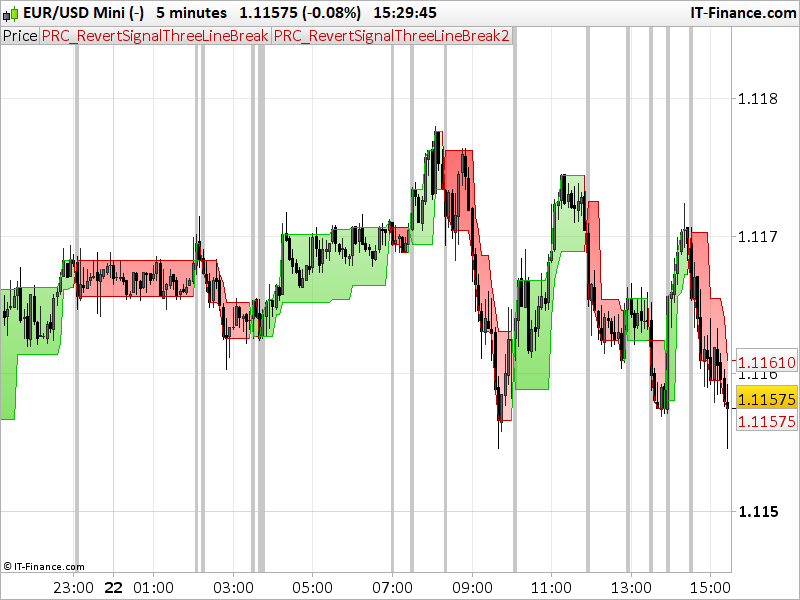
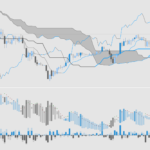
This is a modified version of the three line break price representation. It is composed with 2 lines made of Close price values forming a “cloud”.
- If the trend is bullish and the price breach the lower level of the green cloud, a new bearish trend is taking place.
- If the current trend is bearish and the price breakout the upper band of the cloud, a new bullish trend is forming.
This is a “price action” indicator, signals may be filtered by long term trend analysis with other indicators such as Supertrend for instance.
This indicator has been converted from Nanotrader coding language by a request in the French forum.
//PRC_RevertSignal Three Line Break | indicator
//22.06.2017
//Nicolas @ www.prorealcode.com
//Sharing ProRealTime knowledge
//translated from Nanotrader

if barindex=1 then //barindex
 if (close >= open) then
  xtrend = 1
  trend = xtrend
  xu = close
  xu1 = open
  xu2 = open
  xu3 = open
  CL = xu
  OP = xu1
  LL = OP
  HH = CL
 else
  xtrend = -1
  trend = xtrend
  xu = close
  xu1 = open
  xu2 = open
  xu3 = open
  CL = xu
  OP = xu1
  LL = CL
  HH = OP
 endif
else //barindex continue
 if (xtrend = 1) then
  if (close > xu) then
   trend = xtrend
   xu3 = xu2
   xu2 = xu1
   xu1 = xu
   xu = close
   CL = xu
   OP = xu1
   LL = OP
   HH = CL
  elsif (close < xu3) then
   xtrend = -1
   trend = xtrend
   xu = close
   xu2 = xu1
   xu3 = xu1
   CL = xu
   OP = xu1
   LL = CL
   HH = OP
  else
   trend = xtrend
   CL = CL[1]
   OP = OP[1]
   LL = LL[1]
   HH = HH[1]
  endif
 else //xtrend <>1
  if (close > xu3) then
   xtrend = 1
   trend = xtrend
   xu = close
   xu2 = xu1
   xu3 = xu1
   CL = xu
   OP = xu1
   LL = OP
   HH = CL
  elsif (close < xu) then
   trend = xtrend
   xu3 = xu2
   xu2 = xu1
   xu1 = xu
   xu = close
   CL = xu
   OP = xu1
   LL = CL
   HH = OP
  else
   trend = xtrend
   CL = CL[1]
   OP = OP[1]
   LL = LL[1]
   HH = HH[1]
  endif
 endif
endif

if trend>0 then
 r=0
 g=200
 b=0
else
 r=200
 g=0
 b=0
endif

if trend<>trend[1] then
 BACKGROUNDCOLOR(200,200,200)
endif

RETURN CL coloured (r,g,b), xu3 coloured (r,g,b)
Comments
You must be logged in to post a comment.


//PRC_RevertSignal Three Line Break | indicator //22.06.2017 //Nicolas @ www.prorealcode.com //Sharing ProRealTime knowledge //translated from Nanotrader if barindex=1 then //barindex if (close >= open) then xtrend = 1 trend = xtrend xu = close xu1 = open xu2 = open xu3 = open CL = xu OP = xu1 LL = OP HH = CL else xtrend = -1 trend = xtrend xu = close xu1 = open xu2 = open xu3 = open CL = xu OP = xu1 LL = CL HH = OP endif else //barindex continue if (xtrend = 1) then if (close > xu) then trend = xtrend xu3 = xu2 xu2 = xu1 xu1 = xu xu = close CL = xu OP = xu1 LL = OP HH = CL elsif (close < xu3) then xtrend = -1 trend = xtrend xu = close xu2 = xu1 xu3 = xu1 CL = xu OP = xu1 LL = CL HH = OP else trend = xtrend CL = CL[1] OP = OP[1] LL = LL[1] HH = HH[1] endif else //xtrend 1 if (close > xu3) then xtrend = 1 trend = xtrend xu = close xu2 = xu1 xu3 = xu1 CL = xu OP = xu1 LL = OP HH = CL elsif (close 0 then r=0 g=200 b=0 else r=200 g=0 b=0 endif //if trendtrend[1] then //BACKGROUNDCOLOR(200,200,200) //endif middle = (cl+xu3)/2 RETURN CL coloured (r,g,b), xu3 coloured (r,g,b), middle coloured (0,0,255) style (dottedline,1)
Hello, Nicolas. Thank you! But then I can't! I m sorry. I have the same problem with simple subtraction in Moving Averages... for example, I would like to calculate the deviation from the average to the price, in points and percentages. Can you write me a little code so I can get a lead? I think I just have a board in front of my head...
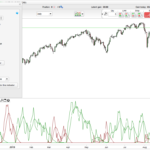
Hello. I use your ThreeLiner in manual trading with as an indicator. He works very well. Thank you very much. I wanted to use the ThreeLiner as a reversing signal in domestic trade and found that the greater the distance between the upper and lower edge, the better it can be traded as a reversing signal. I was wondering if you could tell me how to measure the distance between the top and bottom edge in automated trading? The ThreeLiner works quite well as a reverse signal with the divergence indicator of the CCI, RSI and MACD. Compare for example today Dax 1 min Euro TimeFrame 3 min 16.31 o' clock ThreeLiner, CCI, RSI, MACD with divergences in the same bar and ThreeLiner is at the top of the range. Could be a revert signal? Effective reverse signal? This would like to undergo a backtest.... So let's ask the question again, How do I "measure" the distance? As a code? Kind regards JohnScher


Hi - have come across a difference here in the calculation of the indicator. It's meant to replicate the 3 Line Break price chart and I would say 90-95% of the time the code achieves that perfectly but there a few instances where it does not match. It's slightly puzzling as presumably the background code in PRT that calculates and displays the 3 Line Break price chart should be the same as the one coded in this post - so they both should either be accurate 100% or not, not accurate some of the time which is why its strange. It could be of course that there is something slightly incorrect about the PRT chart itself and not the code.
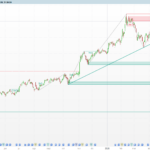
As an example, if you draw up a PRT 3 Line break chart of the 1H DAX and then compare that with the signal generated by the code above for Mon 29 May :
Indicator shows sell signal at 0700 - matches with PRT
Indicator shows buy signal at 1000 - none in PRT
Indicator shows sell signal at 1300 - none in PRT
Indicators shows buy signal at 1500 - none in PRT
As I say - this only happens occasionally as most of the time the code calculates as it's supposed to. Any ideas what could be causing the differences ? Thanks
Ok, many thanks. I've tried messing around with the code myself but am no closer to solving the issue and I'm not proficient enough with coding yet to try and do something more with it. Maybe someone here can look at it and hopefully solve the problem. It explains why in backtest some of the results are not quite correct but it's better than we had before so small steps.....:-)
I don't know, the code of this indicator is one from another platform, not the Three Line Break of prorealtime, that's why it may have some differences in their calculation. Since I do not have source code of how PRT calculate its own TLB charts I'm not able to compare sorry ..

Salut Nicolas,
Petit soucis technique sur cet indicateur.....
Les chandeliers disparaissent à chaque changement de timeframe. Je suis en 15mn.
Je suis obligé d'enlever l'indicateur puis de le remettre.
Merci
An update - To start off with, I've actually used the indicator created by Francesco here on the Dax 30m - https://www.prorealcode.com/prorealtime-trading-strategies/cac-40-strategy-reversal-signal-threelinebreak-indicator/ (Sorry couldn't add a link as it jumps me to the bottom of the page every time I click on "insert link" ) - Thank you Francesco ! I added an 25/55 ema filter and then ran a backtest. Results are pretty good with a 79% WFE ratio and 8% draw and profits split equally between long and shorts (which I like). I plan on working on it a bit more to create a higher win rate. Also aim to test out the non-reverse version of the indicator (ie the normal way !). But so far, the work looks promising, I think I'll need a bit of help in coding the next steps at some point so I'll reach out to see if anyone can help on here. Thanks again Nicolas for coding this !
PS - I can't post a screenshot of the results here as don't have the permissions but maybe I should open a new thread once I have enough confidence that it can progress past an initial stage of scrutiny.
Thank you Nicolas. Its nice to be able to have the indicator and price on a single chart, previously it was only one or the other. I tried a version of this last year (in fact I think you helped with something similar for me) but it didn't quite work as I wanted it to and I put it to the side on my todo list :-). The code posted above however looks more promising. I trade the 3 line break manually and can confirm it does have some success (especially on equities) but obviously there is limited testing as currently I could only test forward. Now that we have an automated code for it will be interesting to see if it the indicator works with history once we can incorporate into a strategy. Also, for info, I found that depending on the market and timeframe a 4/5 line break sometimes works better in providing more accurate signals which I presume is fairly easy to amend the above code for this. Will post here if I find some promising results in my testing. Thanks again.

It works as a good indicator (although in a counterintuitive way ) on the daily cac 40. Will post a strategy soon.

great, thank you
Thank you , have you tried to backtest it with any instrument by any chance?
Thanks a lot
Francesco
Hello Nicolas, thank you for this useful indicator. Could you tell me how I can remove the grey "signal lines"? They really fill up the screen...