Hi There
I am trying to implement a Forex Engulfing strategy that I use in my live trading. I would like to create a backtest for that strategy.
The strategy is simple at structure/ support and resistance points look for a engulfing signal the enter long or short on the open of next candle.
The strategy involves drawing in your own structure points.
Looking at he following post the Murray Math Levels Coincide exactly with these structure points.
https://www.prorealcode.com/prorealtime-indicators/murray-math-levels/
How do you implement Custom indicators in your back-testing strategies
The code will work something like this I just need to know how to implement the custom indicator then I can work out the formula for the buy and sell levels
// timeframe: h1
// instrument: FX
// pairs: EURUSD
//

DEFPARAM CumulateOrders = FALSE

//Need to to implement Muray math levels

BullishEngulfing= OPEN[1] > CLOSE[1] AND CLOSE > OPEN AND CLOSE[1] >= OPEN AND CLOSE >= OPEN[1]

bearishengulfing = CLOSE[1] > OPEN[1] AND OPEN > CLOSE AND OPEN[1] >= CLOSE AND OPEN >= CLOSE[1]

darkcloudcover = CLOSE[1] < OPEN[1] AND OPEN < CLOSE[1] AND CLOSE > OPEN[1]

piercing = CLOSE[1]<OPEN[1] AND OPEN< CLOSE[1] AND CLOSE>(CLOSE[1]+(OPEN[1]-CLOSE[1])/2) AND CLOSE < OPEN[1]

MurrayBuy = Low < Murray[sup] and Low >  Murray[sup]

IF MurrayBuy and (BullishEngulfing or piercing)  THEN
BUY 2 CONTRACT AT MARKET
SET STOP PLOSS 10
ENDIF

MurraySell = High > Murray[res1] and high < Murray[res2]

IF MurraySell and (bearishengulfing or darkcloudcover)  THEN
SELLSHORT 2 CONTRACT AT MARKET
SET STOP PLOSS 10
ENDIF
I have attached images of the ideal sell and buy points.
The horizontal lines that I have drawn in are the manual structure points that I added.
Thanks
Post your indicator as well, easier that way.
You can implement custom indicators with the CALL instruction.
Even if it’s always a better idea to copy/paste (recode) the whole indicator into ProBacktest, use of CALL can save time while development process.
Did you get anywhere with this StantonR please?
I’m seeking a Bot that aligns with my manual trading and this could be it! ha
I’ll check out that Murray Indicator and report back.
GraHal
Hi Grahal
I have sort of put this on the backburner.
Its exactly how I trade forex manually. But I normally look to see if the the candle is near a major support or resistance zone and then look for a engulfing candle.
I am trying to work on something that adds the daily support and resistance lines then trade it on the hour chart.
The murray math levels move according to your timeframe which is not ideal.
Here are some of my videos of how this strategy works
Engulfing strategy
https://youtu.be/bRxHtFJEsKw
Price action drawing support and resistance lines.
https://youtu.be/GLdz3nZS4tw
Would be awesome if we could call the built in horizontal support and resistance lines indicator from our ProOrder code.
Or if we could get the code/calculations that works it out.
Yes I agree Stanton .. that is what we need! Seems so basic / daft not to be able to!
Maybe @Nicolas may have a few ideas when he sees your question above?
GraHal
PS I put Nicolas as a hyperlink in case he has a method of doing a pull where he has been hyperlinked! Doubt it, but a good idea to try and get him here quick! 🙂
 Maz
MazParticipant
Veteran
Hi guys,
Just saw this. How are you getting on with it? I think the general premise might have legs but you’ll need a few entry / exit filters to make it stable and usable in the long run. On its own it will just spin its wheels (but that’s actually a good thing which is why I say it probably has legs).
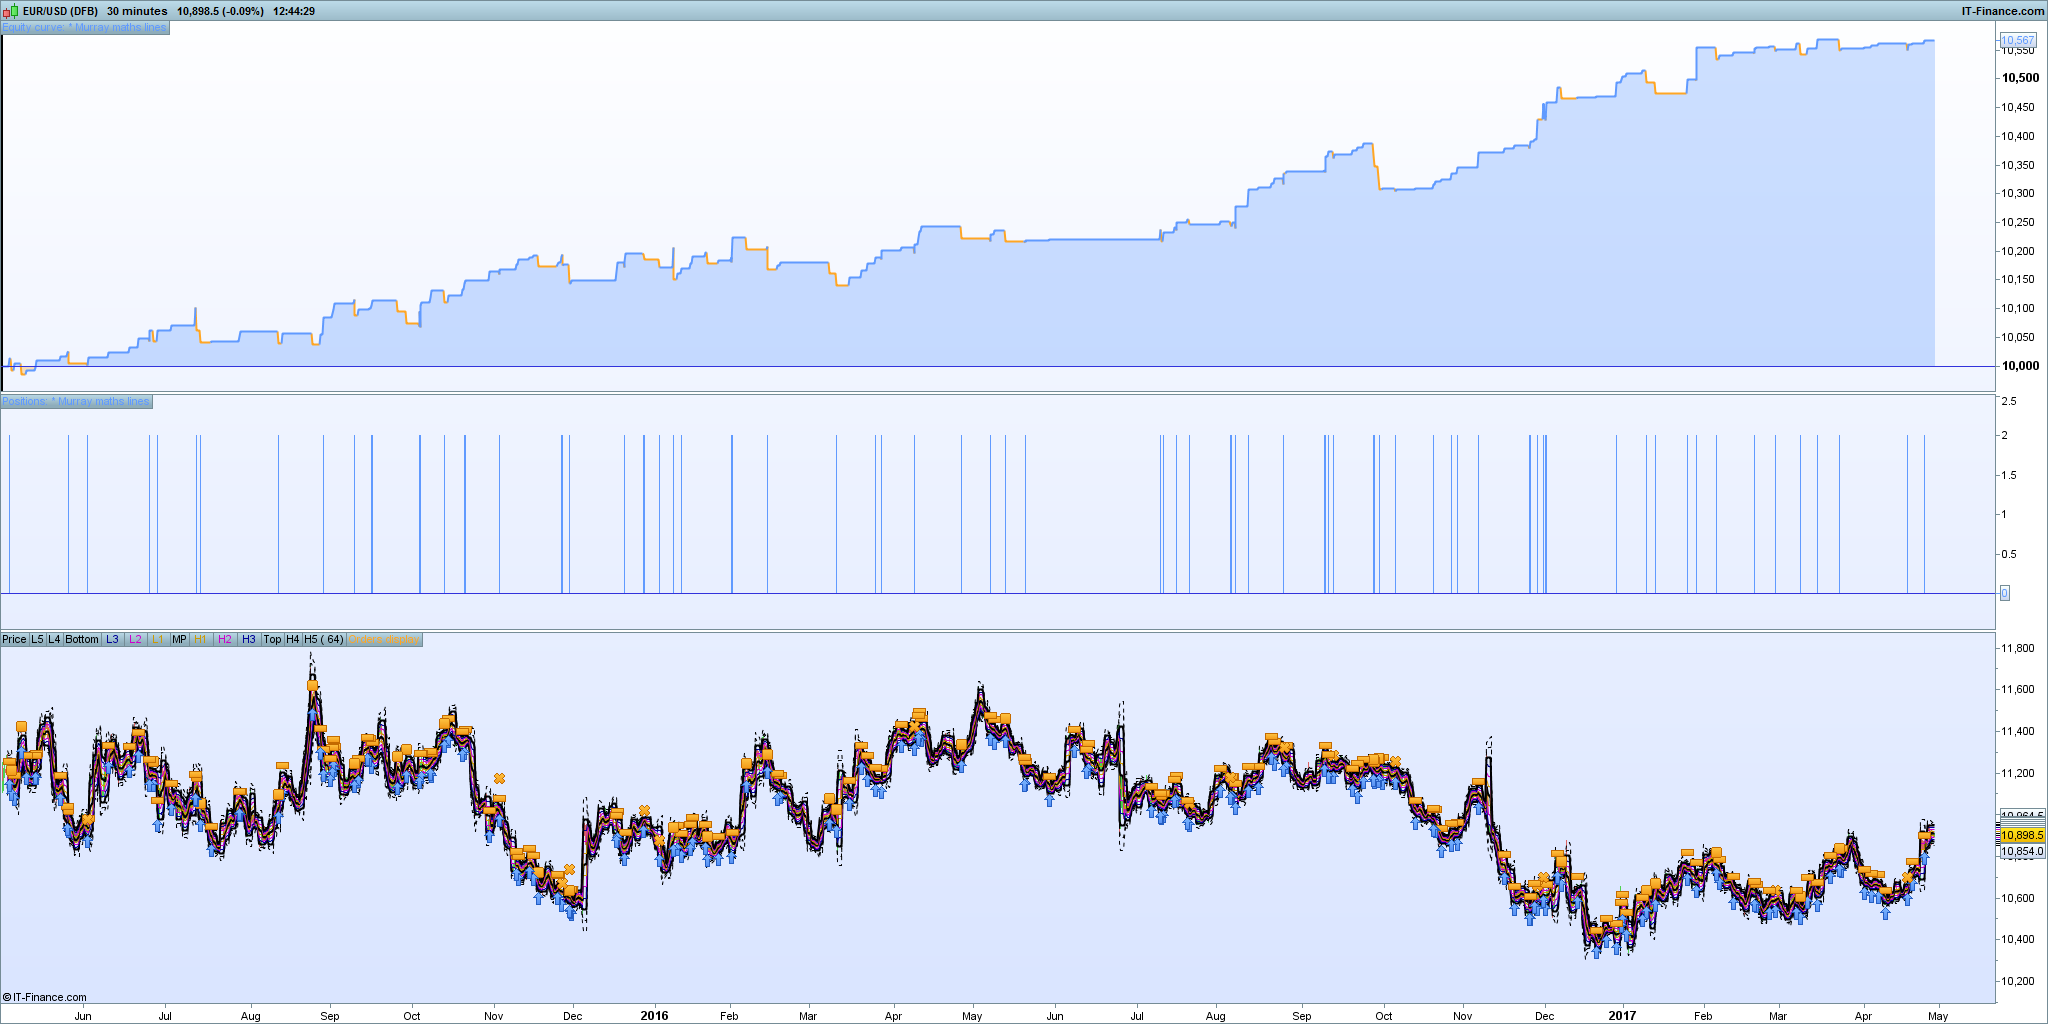
Here is a quick a dirty solution for you (long only – let’s start just on one side). I did a quick optimization on EUR/USD M30. It’s super rough and probably a bit curve fitted so keep that in mind. Nevertheless the parts are there for you to build on. You can have a play now with various some filters and rules and share results if you like. I might come back to this again if I have some time.
All the best,
M
// timeframe: M30
// instrument: FX
// pairs: EUR_USD

DEFPARAM CumulateOrders = FALSE

// period = 32 //64

// Murray Indicator
once Top = undefined
once Btm = undefined
once MP = undefined
once h5 = undefined
once h4 = undefined
once h3 = undefined
once h2 = undefined
once h1 = undefined
once l1 = undefined
once l2 = undefined
once l3 = undefined
once l4 = undefined
once l5 = undefined
//once cc = undefined

mData = close // open / low / typical etc
if barIndex >= period then
h5   = h4 +  ( Top - Btm )/ 8
h4   = Top + ( Top - Btm )/ 8
Top = highest[period](mData)
h3   = Top - ( Top - Btm )/8
h2   = h3 -  ( Top - Btm )/8
h1   = h2 -  ( Top - Btm )/8
MP   = h1 -  ( Top - Btm )/8
l1   = MP -  ( Top - Btm )/8
l2   = l1 -  ( Top - Btm )/8
l3   = l2 -  ( Top - Btm )/8
Btm  = lowest[period](mData)
l4   = Btm - ( Top - Btm )/8
l5   = l4 -  ( Top - Btm )/8
//cc   = customclose
endif

// -- candle pattern logic --
bullishEngulfing = OPEN[1] > CLOSE[1] AND CLOSE > OPEN AND CLOSE[1] >= OPEN AND CLOSE >= OPEN[1]
bearishEngulfing = CLOSE[1] > OPEN[1] AND OPEN > CLOSE AND OPEN[1] >= CLOSE AND OPEN >= CLOSE[1]
darkcloudcover   = CLOSE[1] < OPEN[1] AND OPEN < CLOSE[1] AND CLOSE > OPEN[1]
piercing         = CLOSE[1]<OPEN[1] AND OPEN< CLOSE[1] AND CLOSE>(CLOSE[1]+(OPEN[1]-CLOSE[1])/2) AND CLOSE < OPEN[1]
//MA = average[200, 1](Close)


MurrayBuy  = low  < L1 and low  > L2
MurraySell = high > H1 and high < H2

// -- long entry rules --
bc1 = not longOnmarket and murrayBuy
bc1 = bc1 and (BullishEngulfing or piercing)
//bc1 = bc1 and MA > MA[2]

// -- short entry rules
sc1 = not shortOnMarket and murraySell
sc1 = sc1 and (bearishengulfing or darkcloudcover)

// -- long exit rules --
le1 = longOnMarket
le1 = (le1 and bearishEngulfing ) or (le1 and darkCloudCover)
le1 = le1 or sc1

if bc1 then
BUY 2 CONTRACT AT MARKET
SET STOP PLOSS 10
set target pProfit (MP-close)*pipsize
ENDIF

if le1 then
sell at market
endif

// just looking at long for now
//IF MurraySell and (bearishengulfing or darkcloudcover)  THEN
//SELLSHORT 2 CONTRACT AT MARKET
//SET STOP PLOSS 10
//ENDIF

// ignore (just so the interpreter doesn't crap out)
if l3 or h4 or l5 or h5 then
// ignore
endif
Thanks for that Maz very nice code.
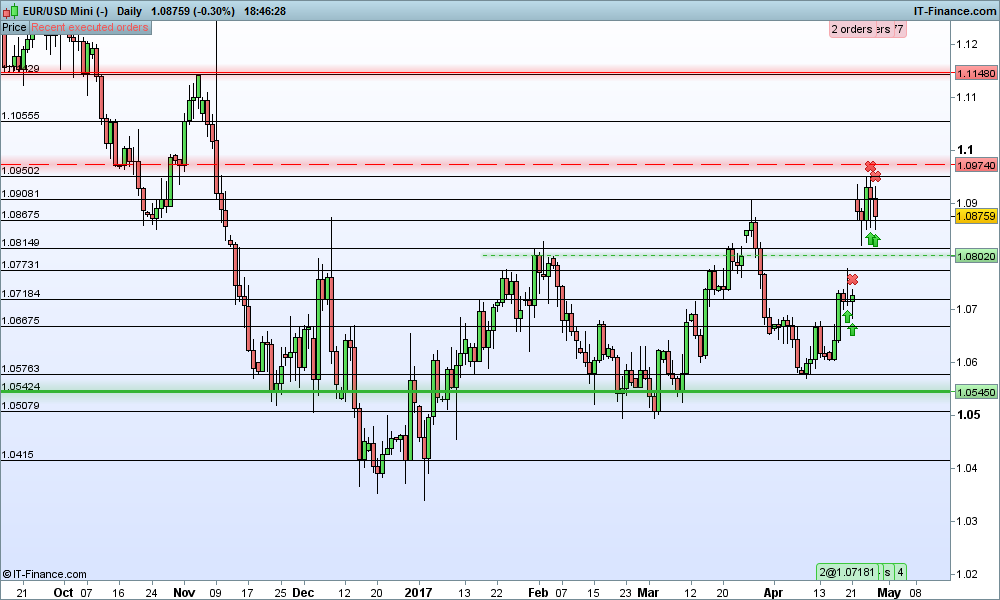
I have tested with the Murray math levels but its not exactly what I have looking for.
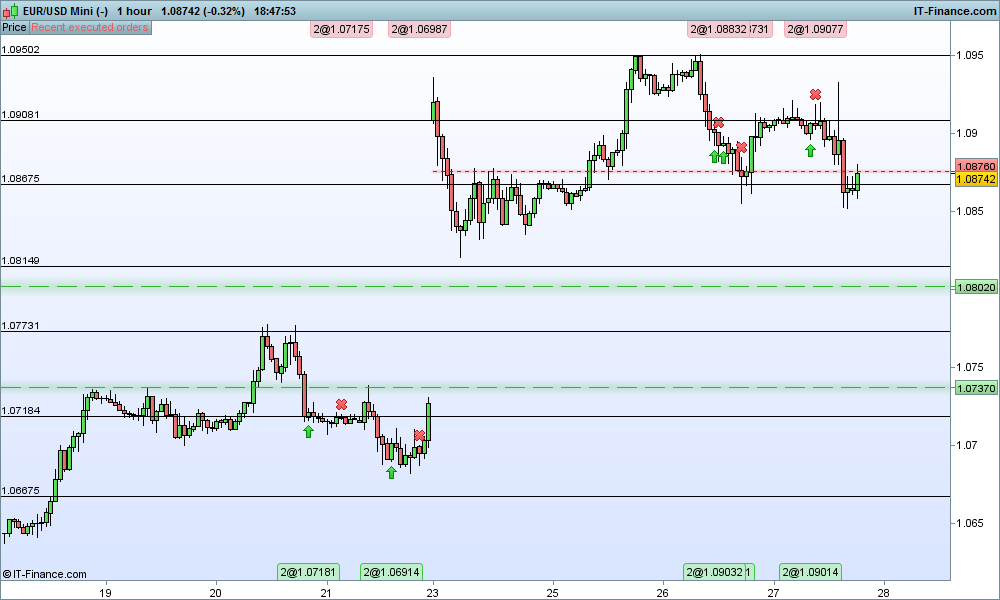
I have attached 2 images the first is the daily chart. I have draw horizontal lines at the areas where the price has been tested more than 2 times.
When you switch to the hourly chart image 2 those lines of support and resistance still hold up.
I am looking for code that that draws horizontal lines at places where the price either was rejected at the support or resistance more than 2 times.
I am looking for code that that draws horizontal lines at places where the price either was rejected at the support or resistance more than 2 times.
This indicator should help: https://www.prorealcode.com/topic/swing-lines-indicator/
But of course, these levels are not stored anywhere since we do not have arrays to store them 🙁 sadly ..
Thanks Nicolas will check it out.
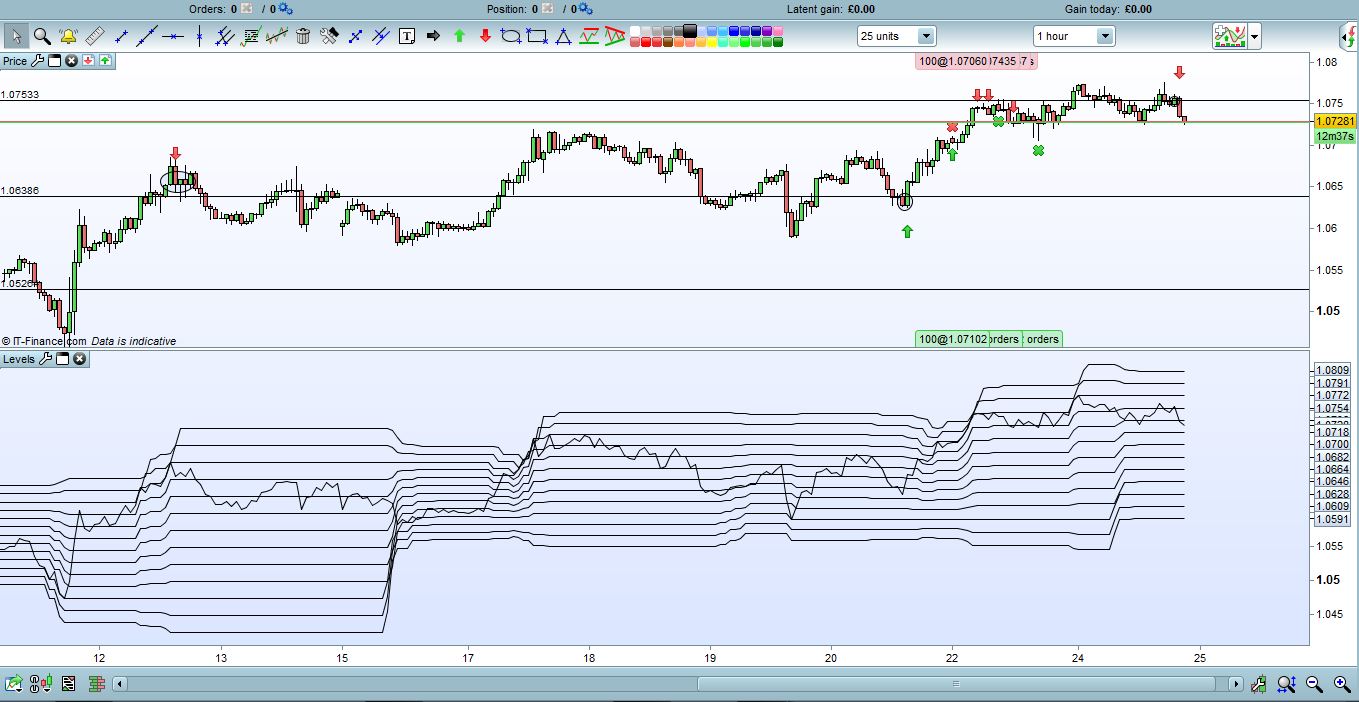
Working on this guys.
Would be great to get some input @grahal @Maz look at this on hour time frame.
margin = 10
numberofrejections = 4
FOR i = 1 TO 365 DO

rescounter = 0
supcounter = 0

dayhigh = DHigh(i)
daylow = DLow(i)

resareatop = dayhigh + margin*pipsize
resareabot = dayhigh - margin*pipsize

suptop = daylow + margin*pipsize
supbot = daylow - margin*pipsize

FOR i = 2 TO 365 DO
if DHigh(i) > resareabot and DHigh(i) < resareatop then
rescounter = rescounter + 1
endif
if DLow(i) < suptop and DLow(i) > supbot then
supcounter = supcounter + 1
endif
next

if rescounter > numberofrejections then
DRAWHLINE(dayhigh)coloured(255,0,0)
endif

if supcounter > numberofrejections then
DRAWHLINE(daylow)coloured(0, 255, 0)
endif

NEXT
return
Looks good Stanton … lines drawn at zones where price has been rejected on 1H TF and lower TFs, but I guess these are following through from Daily support and resistance levels?
GraHal
I hope we can get this coded up into an Algo.
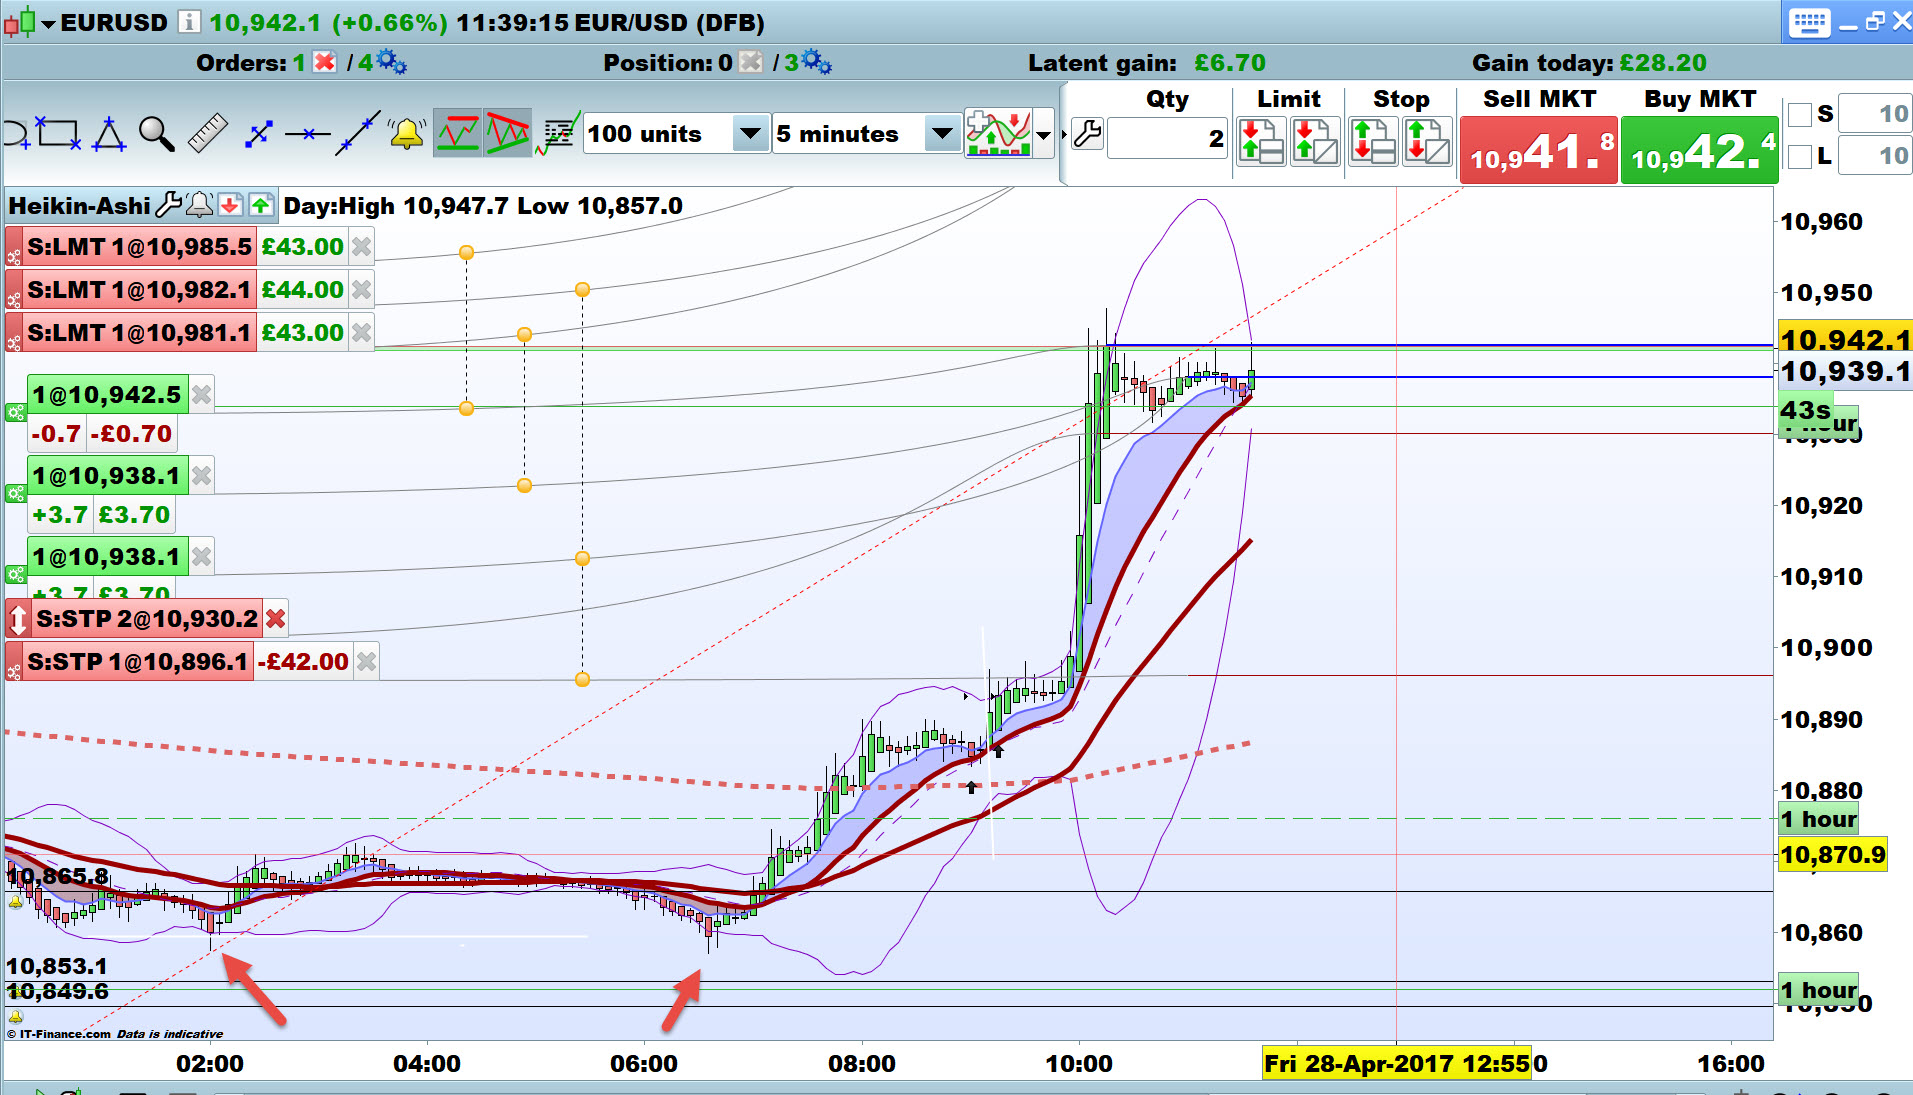
I’m looking at 3 different Algos that have taken Long positions for me Live in the last 30 mins or so (see attached) … all after a good run up, so unless the retrace is 23.60% and then onward and upward it leaves me working out the Elliott Waves and getting hot under the collar watching and waiting!
But see the 2 price rejections (red arrows on attached) followed by a breakout … if only there was an Algo that could track such market structure? Happens all the time, all timeframes, and loads on the low TFs … which is good for a quick in and out! 🙂
GraHal
MazParticipant
Veteran
@GraHal maybe open a new thread topic for this and explain what you are looking for together with a bunch of example screen shots where it happened. Perhaps suggest a entry/exit system to try?