Hello, can someone please modify this indicator.
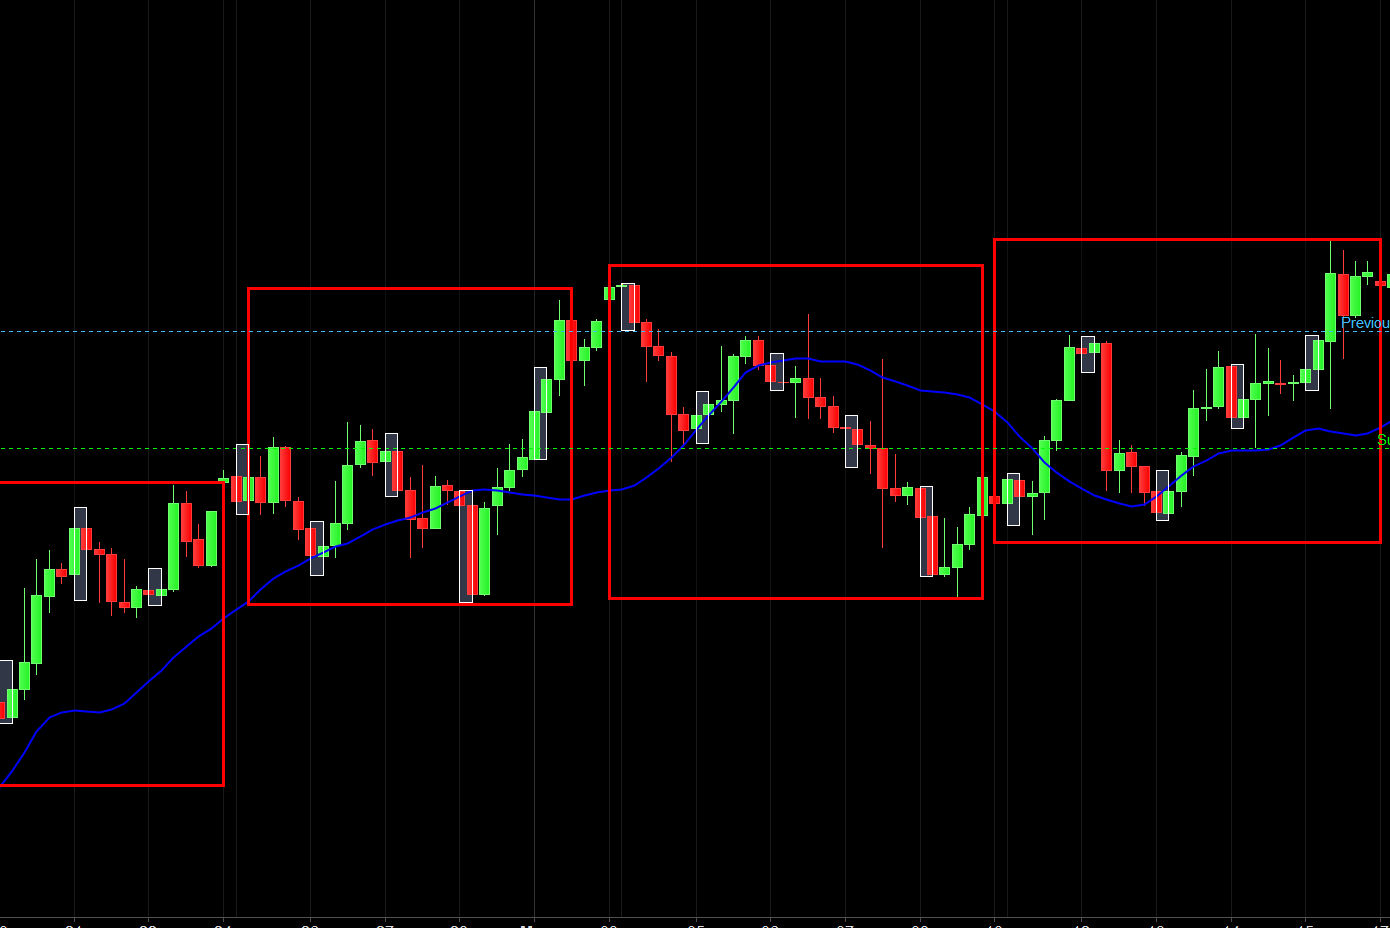
It currently shows 000000=080000
I want it to show 163000-163000
Thanks!
Please add the code in your next post, much easier and faster for anyone to answer the question rather than download/import the file into the platform, thanks.
//defparam drawonlastbaronly = true
if intradaybarindex=0 then
maxvalue=0
minvalue=Dclose(0)*5
endif
timerange = time>000000 and time<=080000
if timerange  then
maxvalue = max(maxvalue , high)
minvalue = min(minvalue , low)
if intradaybarindex=0 then
x1=barindex
endif
if time=080000 then
x2=barindex
DRAWRECTANGLE(x1,maxvalue,x2,minvalue) coloured(0,0,0,0)
endif
endif

RETURN
That is the code for the current 0000-0800 box.
What i would like is the code modified to show 1630-1630, I’ve tried and it’s not playing fair.
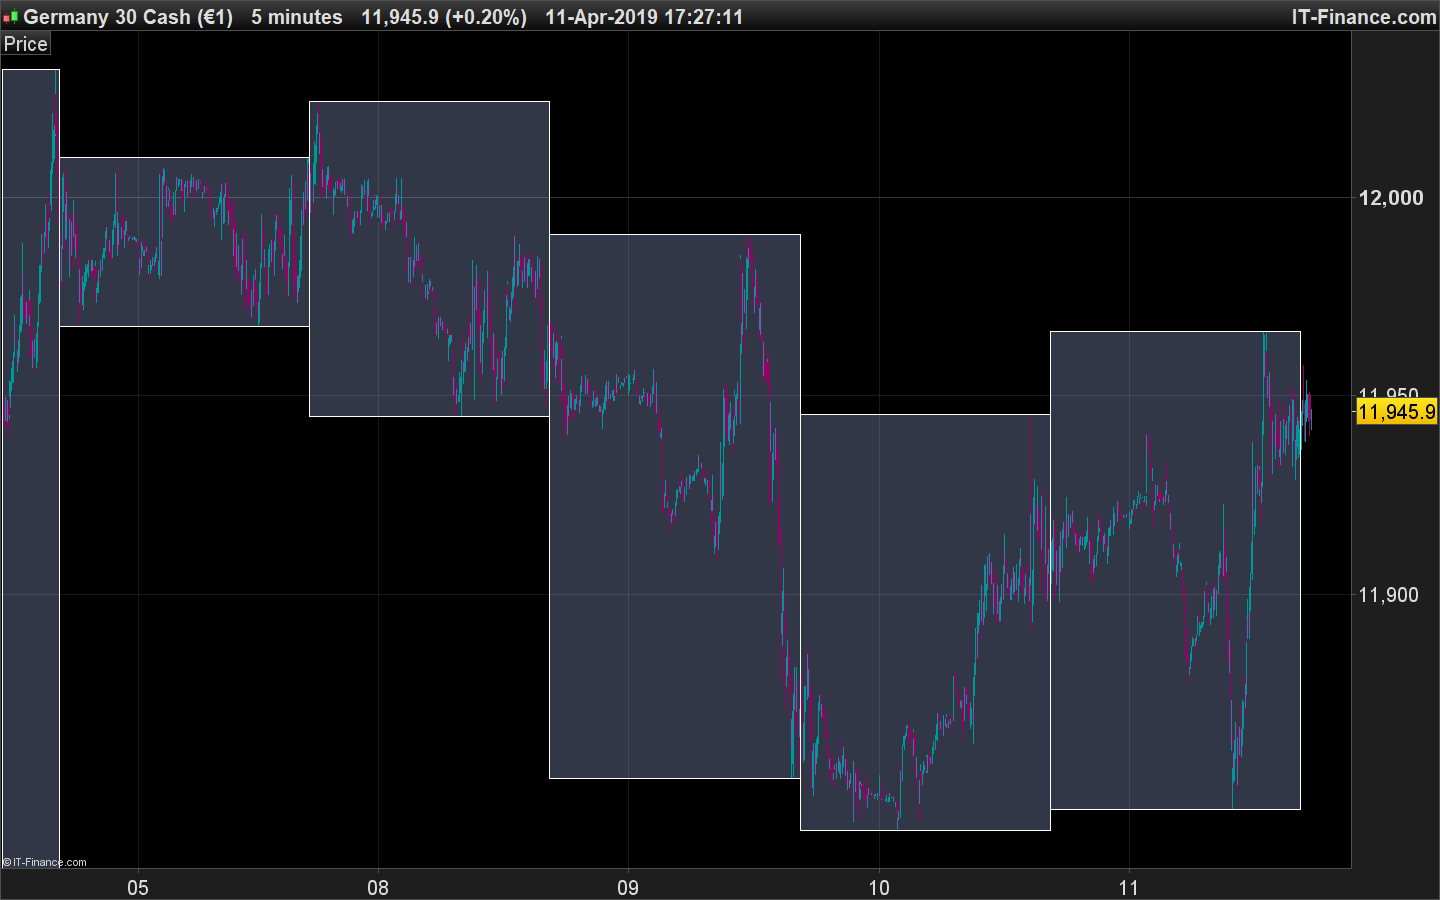
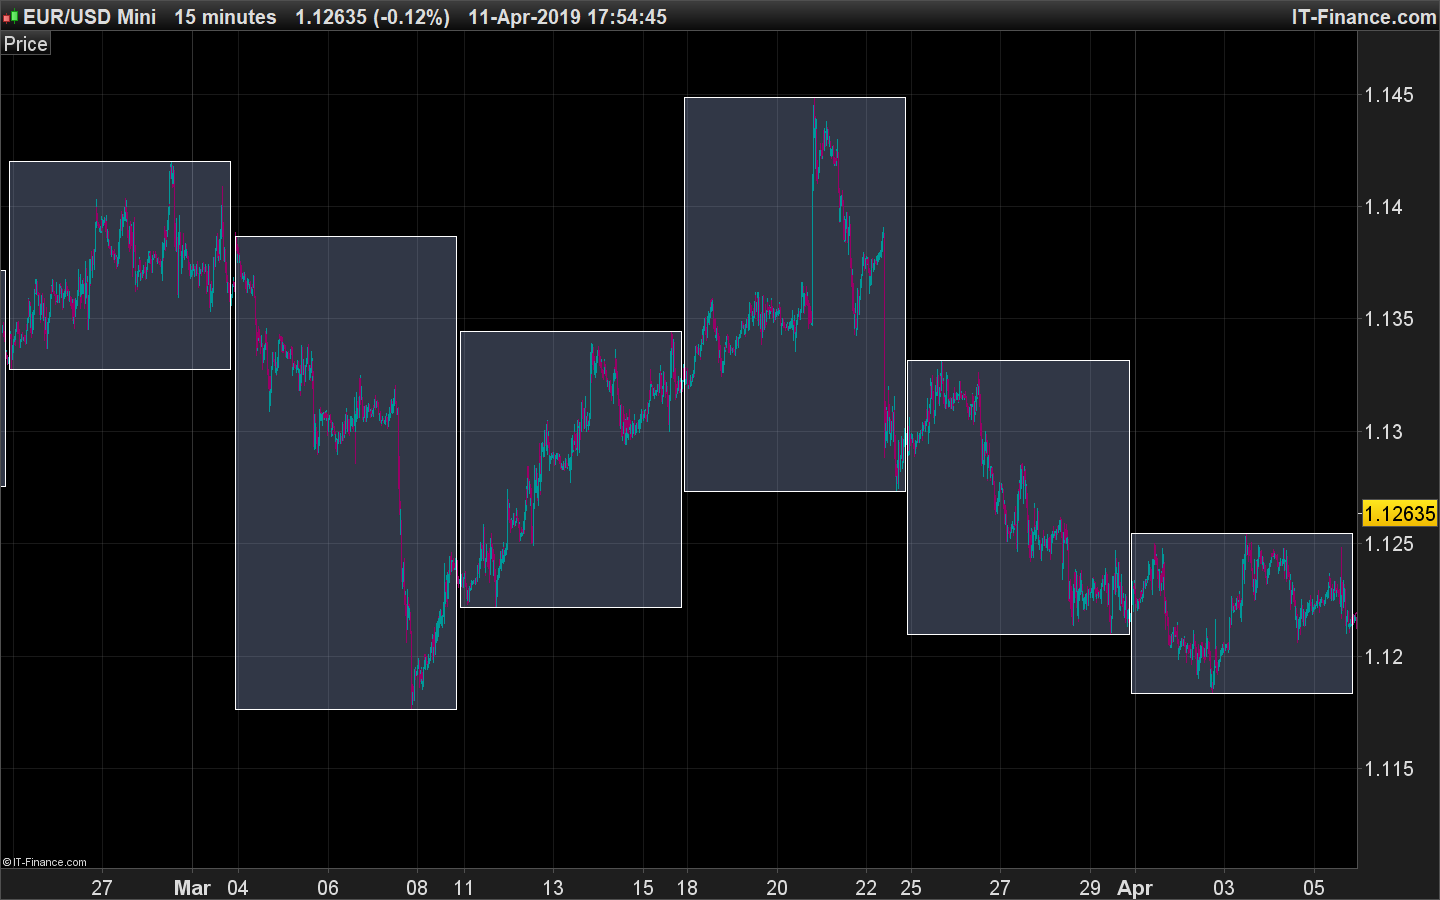
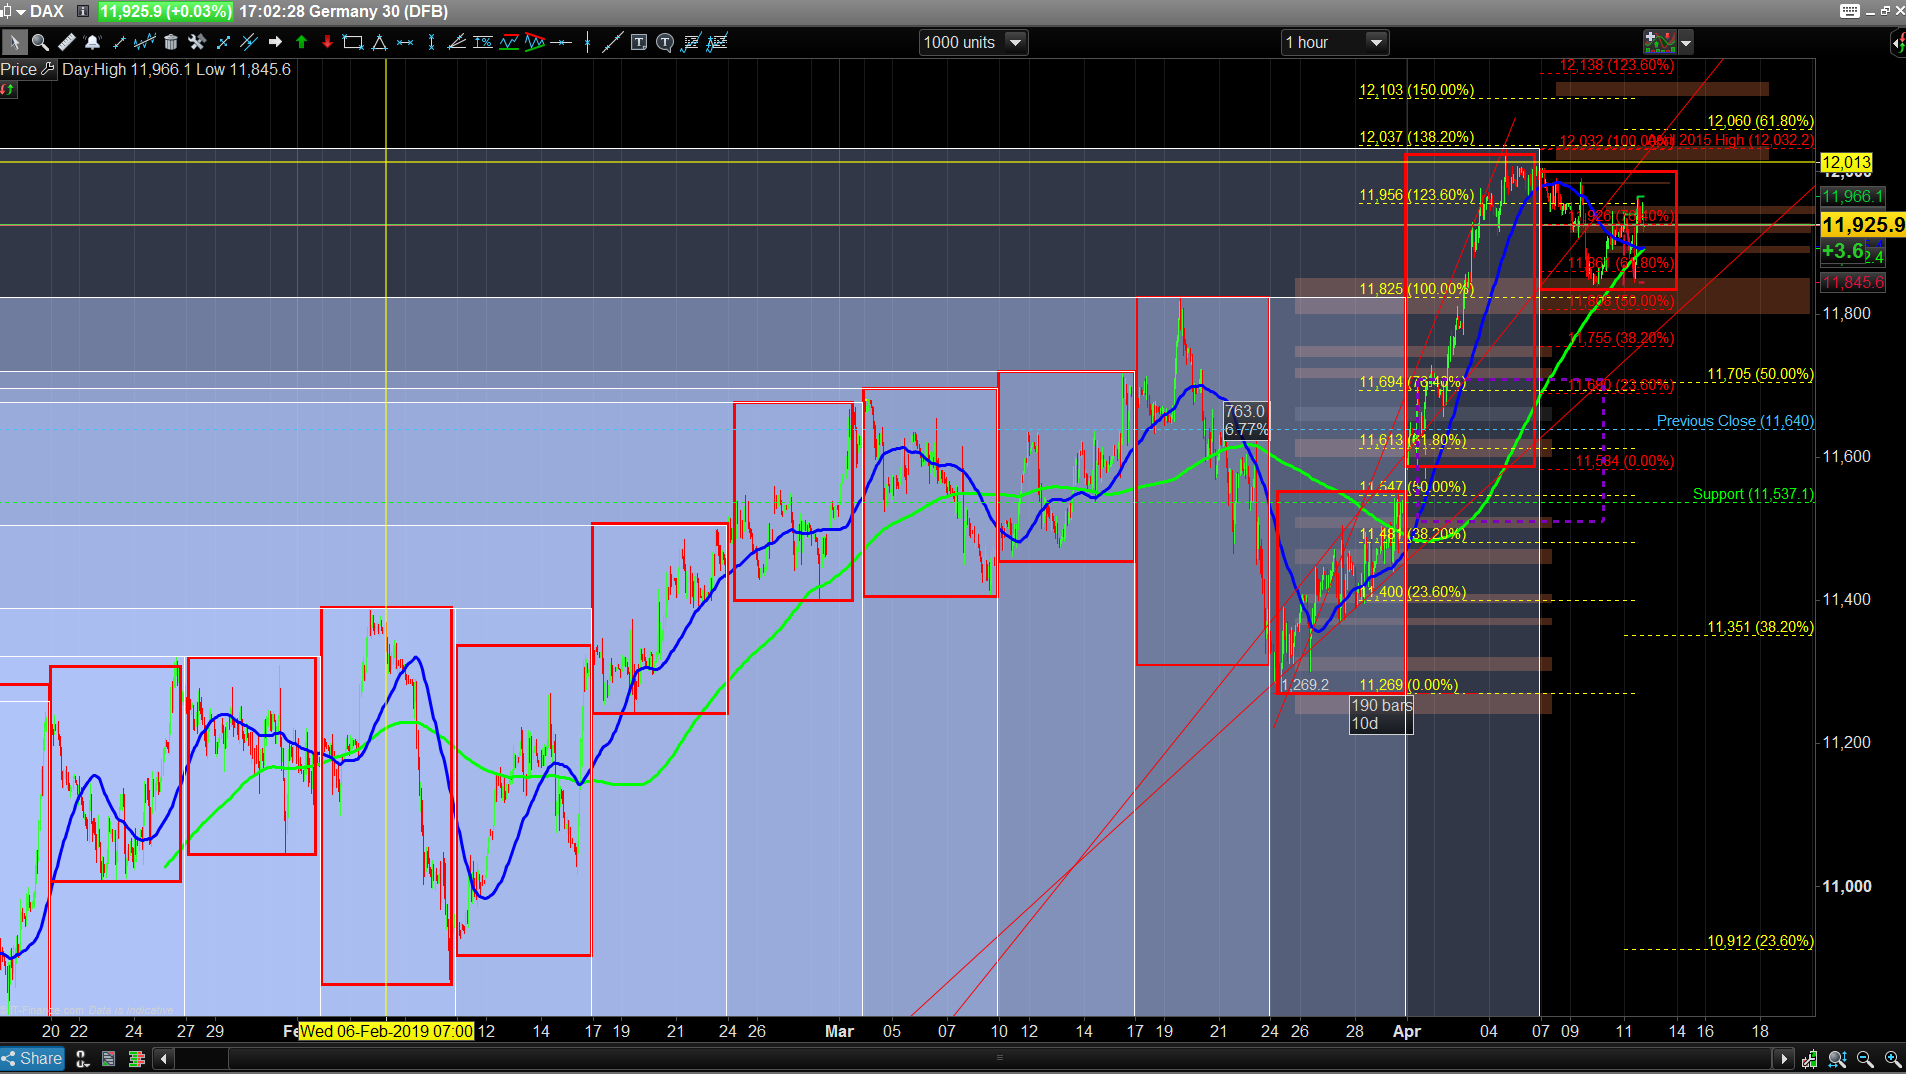
Also, if anyone could modify/make code to show a weekly box, it would be for the DAX, so showing Sunday 2200- Friday 2100, I’ve added an image of what i Manually put on the chart.
Thank you to anyone who can help!
You mean 16:30:00 from one day to the next one at the same hour?
If it’s not possible 1630-1630 then 1700-1600, possible?
I think that this simple code would do the trick:
StartEndHour = 163000

maxvalue = max(maxvalue , high)
minvalue = min(minvalue , low)

if time = StartEndHour then
DRAWRECTANGLE(x1,maxvalue,barindex,minvalue) coloured(0,0,0,0)
x1=barindex
maxvalue=0
minvalue=Dclose(0)*5
endif

RETURN
Good man, could you do a weekly for me?
Try this version:
maxvalue = max(maxvalue , high)
minvalue = min(minvalue , low)

if opentime=220000 and dayofweek=0 then
x1=barindex
maxvalue=0
minvalue=Dclose(0)*5
endif

if time = 210000 and dayofweek=5 then
DRAWRECTANGLE(x1,maxvalue,barindex,minvalue) coloured(0,0,0,0)
endif

RETURN
It looks a bit different, I cant view on any timeframe higher than 1hr..
Are the Friday bar at 210000 and Sunday bar at 220000 visible on your chart? If not, the calculation cannot be done.
This adaptation of Nicolas’ code might be what you want? It resets the rectangles on the first Sunday candle or first trading candle of the week if there are non trading Sundays, Mondays etc. It does not draw a rectangle until a week is completed. Works on any time frame from daily or faster.
maxvalue = max(maxvalue , high)
minvalue = min(minvalue , low)

if opendayofweek < opendayofweek[1] then
DRAWRECTANGLE(x1,maxvalue,barindex-1,minvalue) coloured(0,0,0,0)
x1=barindex
maxvalue=high
minvalue=low
endif

RETURN
Are the Friday bar at 210000 and Sunday bar at 220000 visible on your chart? If not, the calculation cannot be done.
Nope, I’ve tried the code below and that works for me, thanks for your help with the other box coding!
This adaptation of Nicolas’ code might be what you want? It resets the rectangles on the first Sunday candle or first trading candle of the week if there are non trading Sundays, Mondays etc. It does not draw a rectangle until a week is completed. Works on any time frame from daily or faster.
maxvalue = max(maxvalue , high)
minvalue = min(minvalue , low)
if opendayofweek < opendayofweek[1] then
DRAWRECTANGLE(x1,maxvalue,barindex-1,minvalue) coloured(0,0,0,0)
x1=barindex
maxvalue=high
minvalue=low
endif
RETURN
maxvalue = max(maxvalue , high)
minvalue = min(minvalue , low)
if opendayofweek < opendayofweek[1] then
DRAWRECTANGLE(x1,maxvalue,barindex–1,minvalue) coloured(0,0,0,0)
x1=barindex
maxvalue=high
minvalue=low
endif
RETURN
Works for me, thanks mate!
Hello Nicolas,
I tried just to change time , so that I get box from 09.00h to 10.00h…by typing “09000” and 010000″..but it displayed boxes over several days long…?
Please how can I add a simple time change to :
//defparam drawonlastbaronly = true
if intradaybarindex=0 then
maxvalue=0
minvalue=Dclose(0)*5
endif
timerange = time>000000 and time<=080000
if timerange  then
maxvalue = max(maxvalue , high)
minvalue = min(minvalue , low)
if intradaybarindex=0 then
x1=barindex
endif
if time=080000 then
x2=barindex
DRAWRECTANGLE(x1,maxvalue,x2,minvalue) coloured(0,0,0,0)
endif
endif

RETURN
The box should be displayed from 09.00h to 10.00h in the morning.
Merci beacucoup, Nicola!
Regards Micha
Try uncommenting line 1 and move line 15 to line 18.