


screener cycle de volatilite et point pivot

Viewing 5 posts - 1 through 5 (of 5 total)

  • Author
    Posts
  • #107732 quote
    ismael76ismael76
    Participant
    New

    bonjour,

    je cherche a construire un screener avec 2 indicateurs que j’utilise.

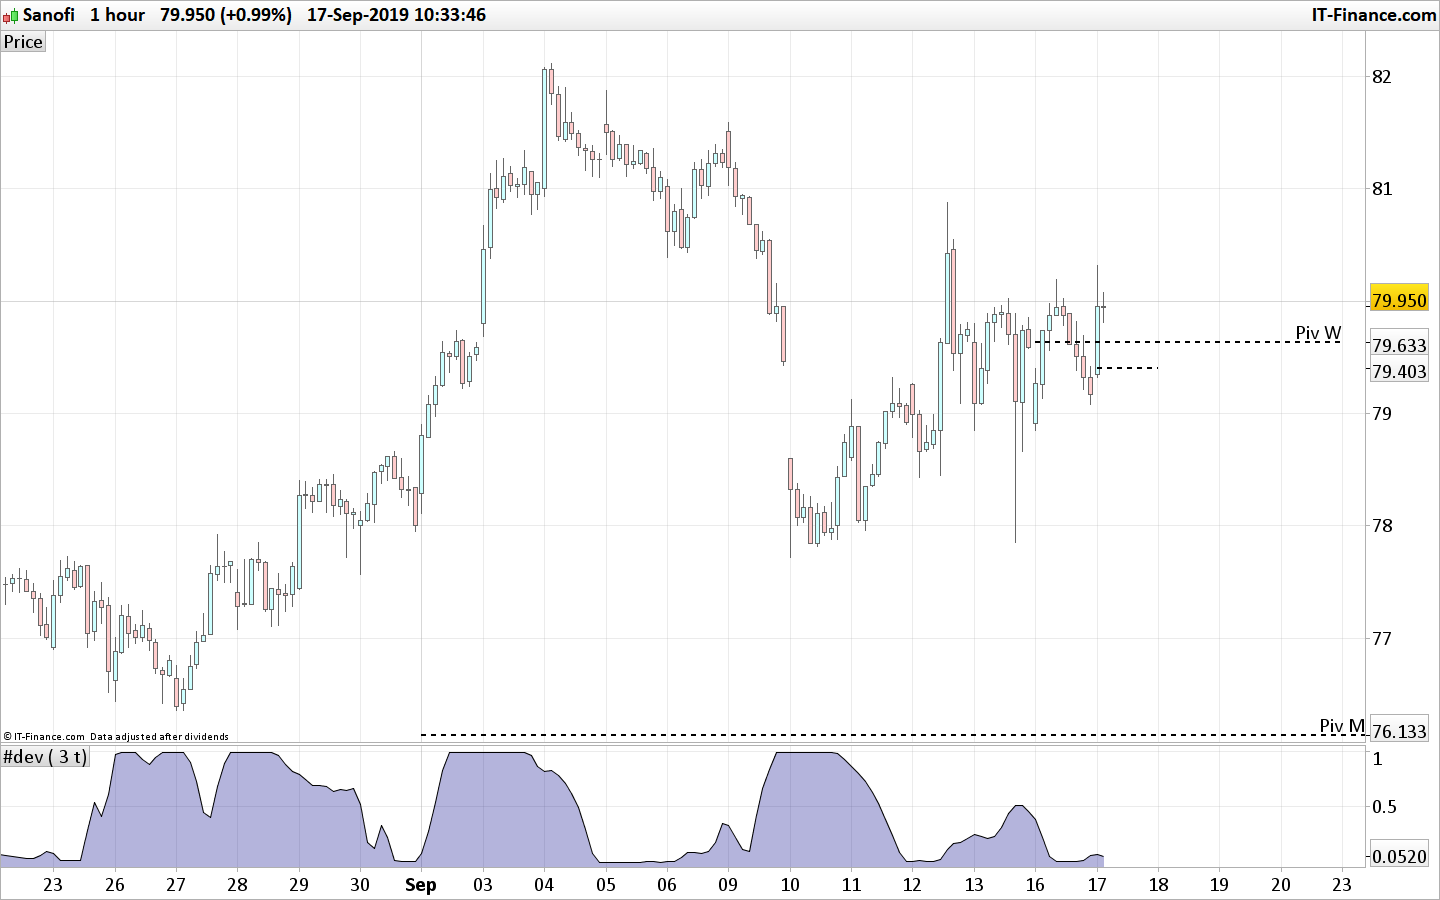
    le 1er est les points pivots classique journalier, hebomadaire et mensuel.

    le 2e est le cycle de volatilité.

    le code de l’indicateur du cycle de volatilité que j’utilise est le suivant:

    a=bollingerbandwidth[18](close)

    b=highest[18](a)

    c=lowest[18](a)

    d=(a-b)/(b-c)

    return average[2](d)+1

    cet indicateur est borné de 0 a 1.

    le screener doit me detecter les actions, paires ou devises quand le prix est au dessus des 3 points pivots et que le cycle de volatilité est inferieure a 0.1

    et me detecter aussi toutes celle où le prix est sous les 3 points pivots journaliers,hebdomadaire et mensuel et le cycle de volatilite qui est inferieure a 0.1

    cette variable 0.1, je veux pouvoir la modifier a souhait si possible.

    je vous remercie de votre aide.

    #107733 quote
    NicolasNicolas
    Keymaster
    Legend

    Sur quelle(s) unité(s) de temps sera utilisé le screener ?

    #107820 quote
    ismael76ismael76
    Participant
    New

    bonjour,

    peut -il etre adaptable a n’importe quel UT?

    je l’utilisable en h1 pour les actions et en M30/ m15 pour les indices paires.

    est ce possible?


    merci de ton aide

    #107829 quote
    NicolasNicolas
    Keymaster
    Legend

    Ci-joint le code du screener pour le test supérieur aux points pivots. Pour le test inférieur, je pense que tu pourras l’adapter facilement 🙂

    If Month<>Month[1] then
    monthlyHigh = Highest[max(1,BarIndex - lastMonthBarIndex)](High)[1]
    monthlyLow = Lowest[max(1,BarIndex - lastMonthBarIndex)](Low)[1]
    lastMonthBarIndex = BarIndex
    
    monthlyPivot = (monthlyHigh + monthlyLow + Close[1]) / 3
    endif
    
    If DayOfWeek<DayOfWeek[1] then
    weeklyHigh = Highest[BarIndex - lastWeekBarIndex](High)[1]
    weeklyLow = Lowest[BarIndex - lastWeekBarIndex](Low)[1]
    lastWeekBarIndex = BarIndex
    
    weeklyPivot = (weeklyHigh + weeklyLow + Close[1]) / 3
    endif
    
    dailypivot = (dhigh(1)+dlow(1)+dclose(1))/3
    
    a=bollingerbandwidth[18](close)
    b=highest[18](a)
    c=lowest[18](a)
    d=(a-b)/(b-c)
    vol= average[2](d)+1
    
    test = close>monthlypivot and close>weeklypivot and close>dailypivot and vol<0.1
    
    screener[test]
    ismael76 thanked this post
    screener-point-pivots-et-volatilité.png screener-point-pivots-et-volatilité.png
    #107833 quote
    ismael76ismael76
    Participant
    New

    grand MERCI nicolas,

    il fonctionne parfaitement.

    j’ai meme reussi a le modifier pour qu’il me screen les 2 modes.

    super

    Nicolas thanked this post
Viewing 5 posts - 1 through 5 (of 5 total)
  • You must be logged in to reply to this topic.

ProRealAI ProRealAI New

Stuck on this ProBuilder code?

Describe what this topic is trying to build, in plain English, and ProRealAI writes the ProRealTime™ indicator, screener or system for you.

Available in 7 languages
Try ProRealAI

screener cycle de volatilite et point pivot


ProScreener : Scanners de Marché & Détection

New Reply
Author
author-avatar
ismael76 @ismael76 Participant
Summary

This topic contains 4 replies,
has 2 voices, and was last updated by ismael76ismael76

7 years ago.

Topic Details
Forum: ProScreener : Scanners de Marché & Détection
Language: French
Started: 09/16/2019
Status: Active
Attachments: 1 files
ProRealCode ProRealCode
Loading...

